Daniocell
tmem17 (fin)
transmembrane protein 17
ZFIN
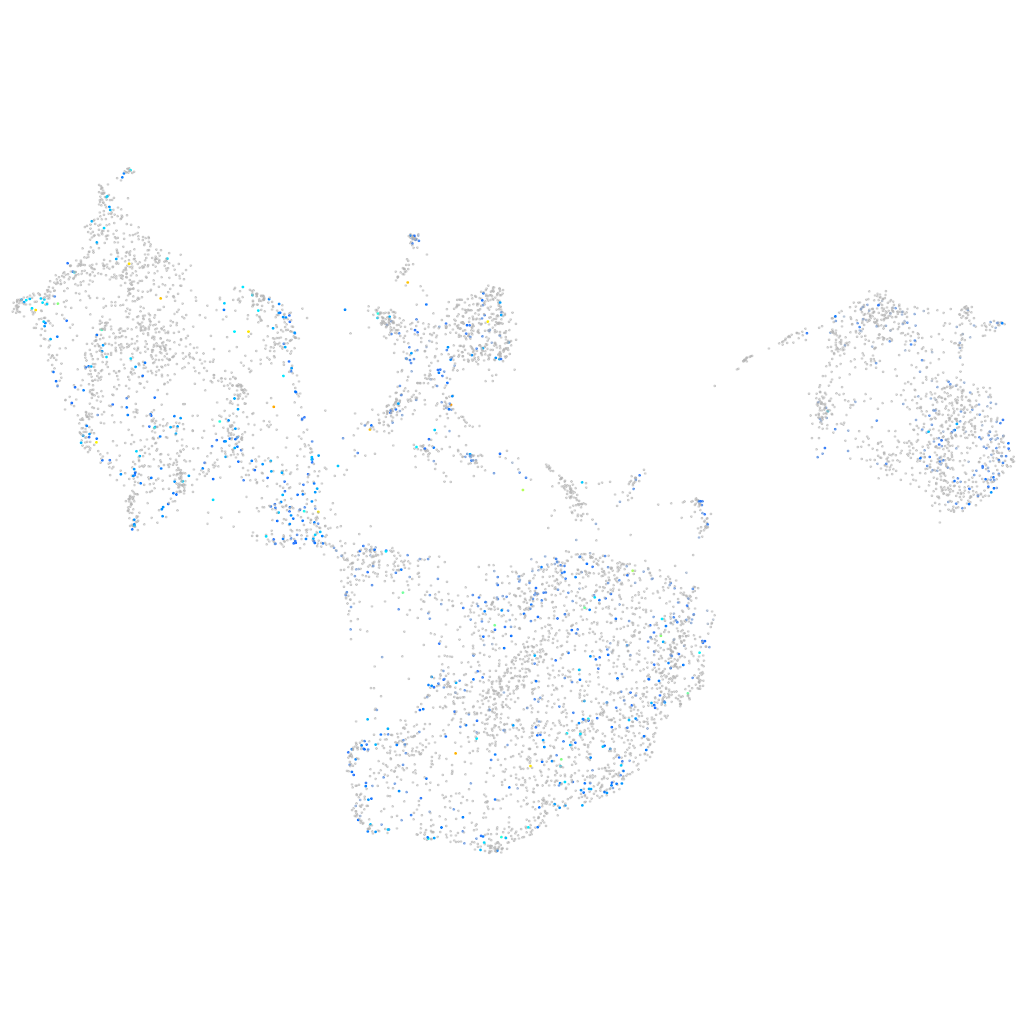
Gene expression UMAP
Display:
Expression
Stage
Other cell groups
all cells
blastomeres
PGCs
endoderm
axial mesoderm
muscle
mural cells /
non-skeletal muscle
mesenchyme
hematopoietic /
vasculature
pronephros
neural
spinal cord / glia
eye
taste / olfactory
otic / lateral line
epidermis
periderm
fin
ionocytes / mucous
pigment cells
Expression by stage/cluster
Correlated gene expression
Positive correlation
Negative correlation
Gene
r
Gene
r
cldn15lb
0.112
icn2
-0.062
opn8c
0.108
tcnbb
-0.058
armc3
0.107
wu:fa03e10
-0.058
rarga
0.106
agr1
-0.057
si:ch211-160o17.3
0.106
scel
-0.054
hnrnpabb
0.106
si:ch211-76l23.4
-0.053
SP5 (1 of many)
0.104
cldne
-0.052
sumo3a
0.101
anxa1b
-0.052
sap18
0.100
rhbg
-0.052
hmgb2a
0.095
si:ch211-125o16.4
-0.051
pmp22a
0.095
fut9d
-0.050
h3f3a
0.095
abcb5
-0.050
hmgb2b
0.094
lye
-0.050
ran
0.094
soul2
-0.050
smoc1
0.093
cyt1
-0.049
scospondin
0.092
ucp1
-0.049
eif5a2
0.091
mgst1.2
-0.049
tuba8l4
0.091
icn
-0.049
mir21-1
0.091
anxa1c
-0.049
alyref
0.091
apodb
-0.049
BX571762.2
0.091
si:dkey-221j11.3
-0.049
si:zfos-911d5.4
0.091
wu:fb18f06
-0.049
XLOC-025298
0.091
si:ch73-52f15.5
-0.048
LOC108191704
0.091
zgc:193505
-0.048
cirbpb
0.091
si:dkeyp-51b9.3
-0.047
dzip1l
0.091
ppl
-0.047
chaf1b
0.091
ch25hl1.1
-0.047
khdrbs1a
0.090
krt17
-0.047
hmga1a
0.090
lpcat4
-0.047
CR354444.1
0.090
si:ch211-195b11.3
-0.047
si:dkey-83m22.7
0.090
nqo1
-0.047
LOC108181606
0.089
si:dkey-87o1.2
-0.047
XLOC-040575
0.089
si:dkey-247k7.2
-0.047
LOC110440044
0.089
selenow2b
-0.046
LOC108190667
0.089
zgc:163030
-0.046