Daniocell
tmed1a (hematopoietic / vasculature)
transmembrane p24 trafficking protein 1a
ZFIN
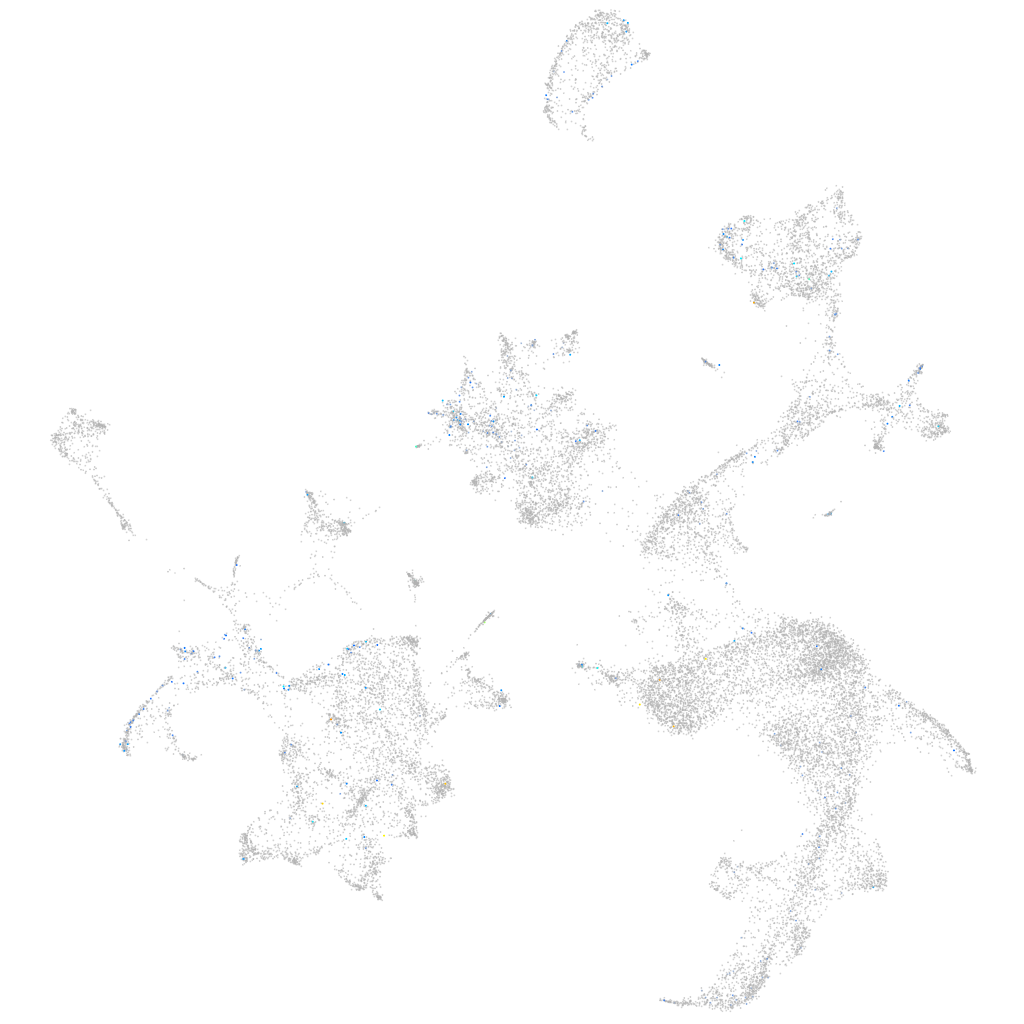
Gene expression UMAP
Display:
Expression
Stage
Other cell groups
all cells
blastomeres
PGCs
endoderm
axial mesoderm
muscle
mural cells /
non-skeletal muscle
mesenchyme
hematopoietic /
vasculature
pronephros
neural
spinal cord / glia
eye
taste / olfactory
otic / lateral line
epidermis
periderm
fin
ionocytes / mucous
pigment cells
Expression by stage/cluster
Correlated gene expression
Positive correlation
Negative correlation
Gene
r
Gene
r
si:dkeyp-80d11.14
0.183
hbae1.1
-0.041
si:dkey-222h21.5
0.151
hbbe1.3
-0.039
si:ch211-137a8.2
0.129
hbbe2
-0.038
pde9al
0.116
hbae3
-0.037
sptssb
0.114
hbae1.3
-0.037
si:ch211-233m11.1
0.108
creg1
-0.036
LOC110438012
0.105
cahz
-0.036
RF00093
0.092
hbbe1.1
-0.036
LOC110438837
0.088
hbbe1.2
-0.036
CR354556.2
0.086
hemgn
-0.036
rhcgb
0.086
tspo
-0.033
LOC101882020
0.083
blvrb
-0.033
LOC101884182
0.081
slc4a1a
-0.032
BX324212.1
0.081
nt5c2l1
-0.031
LOC108192157
0.080
si:ch211-250g4.3
-0.030
LO018605.3
0.077
zgc:163057
-0.030
SPHK1
0.077
hif1al2
-0.029
LOC103911612
0.075
alas2
-0.028
LOC100149931
0.071
nmt1b
-0.027
rnf41l
0.071
zgc:56095
-0.026
LOC101886193
0.070
si:ch211-207c6.2
-0.025
si:dkey-13m1.2
0.070
fbxo32
-0.025
CABZ01030033.1
0.068
si:ch211-227m13.1
-0.025
cyth3b
0.068
tmod4
-0.024
BX510941.1
0.067
fth1a
-0.024
XLOC-005605
0.067
klf1
-0.023
si:dkey-71l1.1
0.066
epb41b
-0.022
nanos3
0.066
rhd
-0.022
psmb13a
0.065
plac8l1
-0.021
LOC108180164
0.065
add2
-0.021
LOC561346
0.063
ucp3
-0.021
gdpd3b
0.063
prdx2
-0.021
miox
0.061
tbcelb
-0.020
mfap2
0.061
faxdc2
-0.020
LOC110438835
0.060
rhag
-0.019