Daniocell
tigarb (pronephros)
TP53 induced glycolysis regulatory phosphatase b
ZFIN
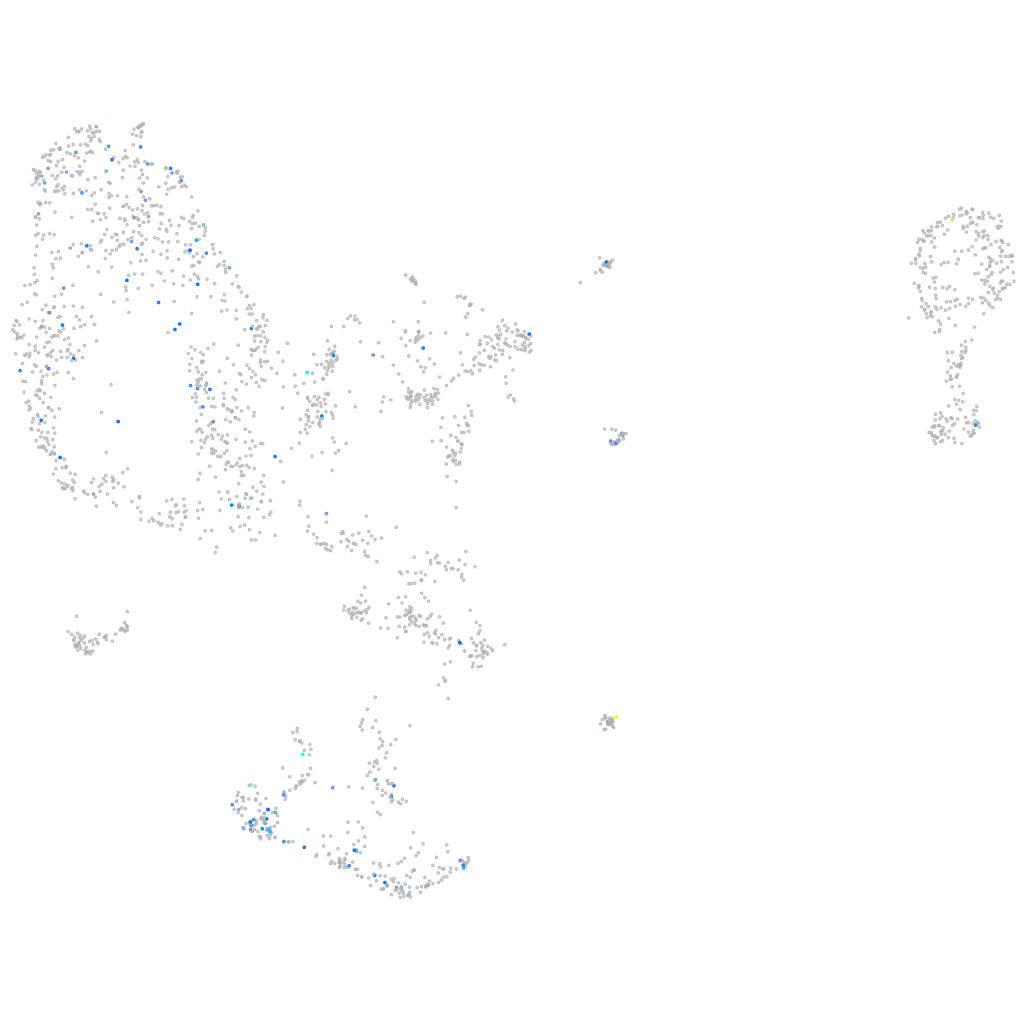
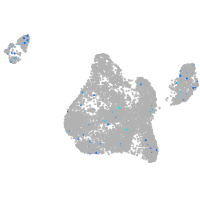
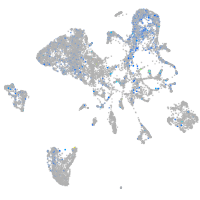
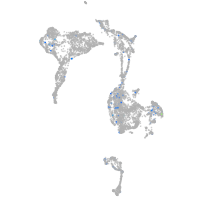
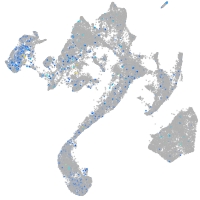
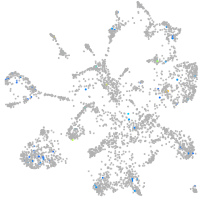
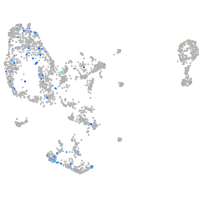
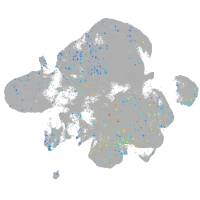
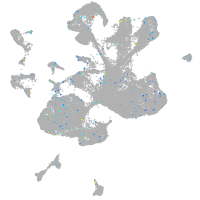
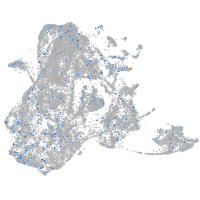
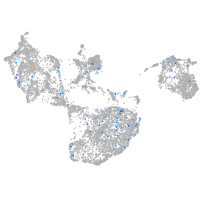
Gene expression UMAP
Display:
Expression
Stage
Other cell groups
all cells
blastomeres
PGCs
endoderm
axial mesoderm
muscle
mural cells /
non-skeletal muscle
mesenchyme
hematopoietic /
vasculature
pronephros
neural
spinal cord / glia
eye
taste / olfactory
otic / lateral line
epidermis
periderm
fin
ionocytes / mucous
pigment cells
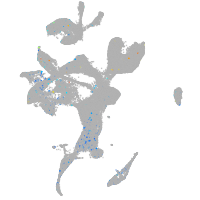
Expression by stage/cluster
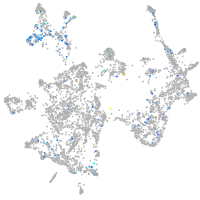
Correlated gene expression
Positive correlation
Negative correlation
Gene
r
Gene
r
TMEM216
0.253
hspb1
-0.093
arhgef19
0.245
hdac1
-0.090
XLOC-003052
0.226
ilf3b
-0.086
XLOC-036686
0.226
marcksb
-0.084
si:dkey-192l18.9
0.223
wu:fb97g03
-0.081
XLOC-038611
0.222
eif5a2
-0.078
XLOC-018356
0.222
nucks1a
-0.077
rgs1
0.216
anp32a
-0.076
wwox
0.210
marcksl1b
-0.076
AL935198.2
0.209
ccdc85b
-0.075
prnpb
0.179
fam133b
-0.075
si:dkey-7i4.1
0.175
ptmab
-0.075
npy8ar
0.173
si:ch211-222l21.1
-0.074
syt10
0.171
lmo2
-0.073
LOC108190733
0.170
tspan7
-0.073
si:ch211-214c20.1
0.168
ewsr1a
-0.072
clcnk
0.167
h2afva
-0.071
zgc:162184
0.166
anp32e
-0.071
si:dkey-32e23.4
0.165
si:ch73-1a9.3
-0.071
ect2l
0.165
dpcd
-0.070
XLOC-021899
0.160
si:ch73-281n10.2
-0.070
si:ch73-54f23.4
0.159
rbm25b
-0.070
FO704661.1
0.158
sae1
-0.069
chchd10
0.158
si:ch211-214j24.10
-0.069
bsnd
0.158
apoeb
-0.069
CU571069.1
0.157
smarca4a
-0.069
hsc70
0.157
tuba1a
-0.068
mthfd1a
0.155
smc1al
-0.068
ticam1
0.155
znfl2a
-0.068
kcnj1a.1
0.151
tmeff1b
-0.067
si:dkey-16p21.8
0.151
cbx3a
-0.067
atp5if1b
0.150
hnrnpub
-0.067
asb1
0.150
ube2e2
-0.067
LOC101882713
0.149
cirbpb
-0.066
ccl19a.1
0.149
si:ch211-288g17.3
-0.066