Daniocell
tfpia (periderm)
tissue factor pathway inhibitor a
ZFIN
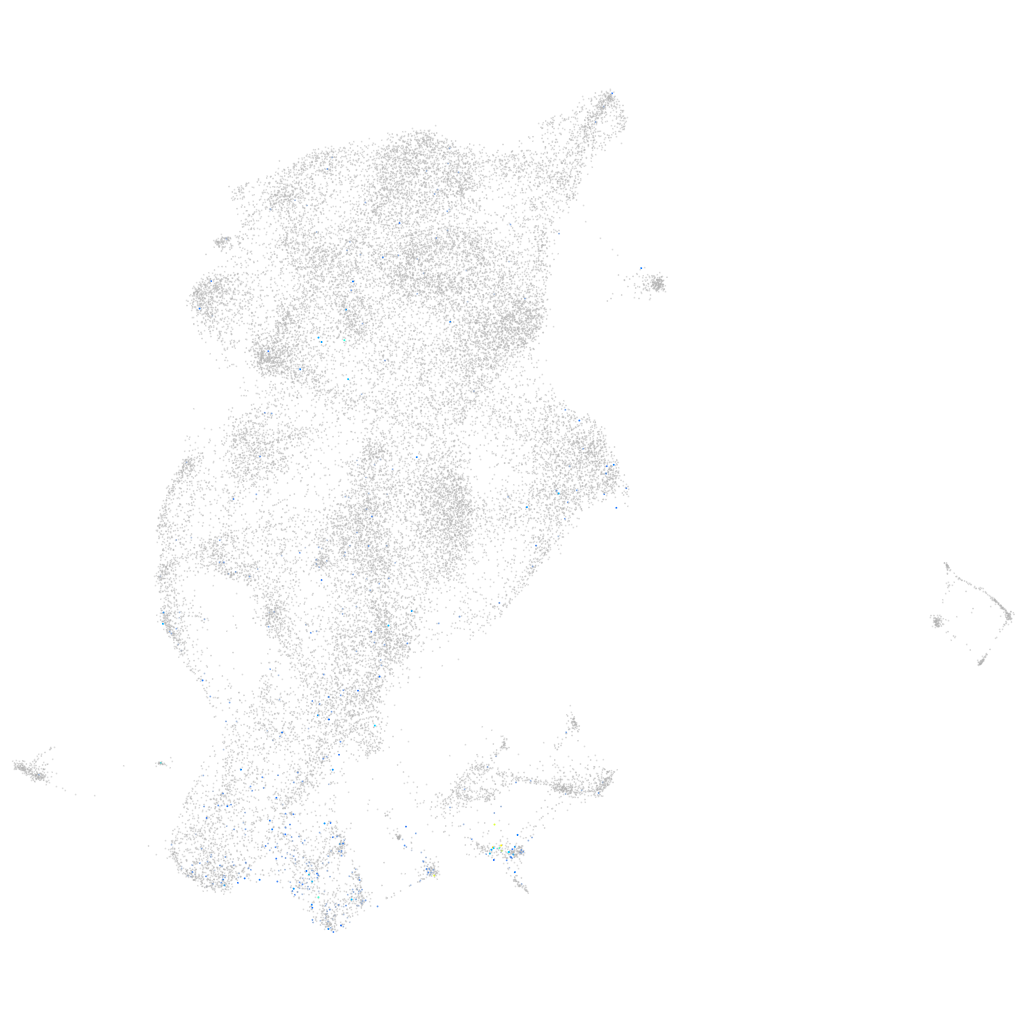
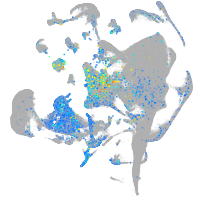
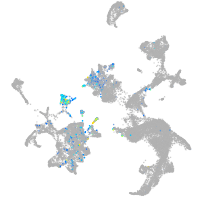
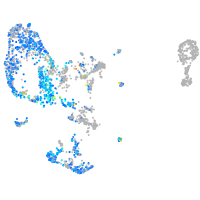
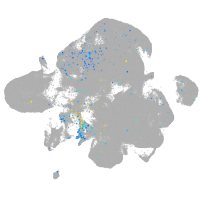
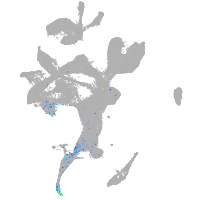
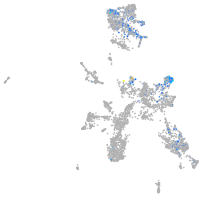
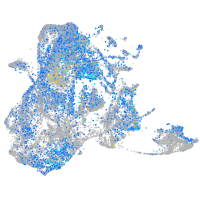
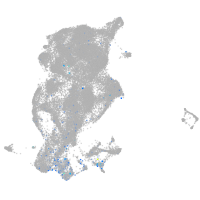
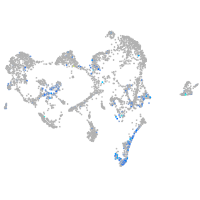
Gene expression UMAP
Display:
Expression
Stage
Other cell groups
all cells
blastomeres
PGCs
endoderm
axial mesoderm
muscle
mural cells /
non-skeletal muscle
mesenchyme
hematopoietic /
vasculature
pronephros
neural
spinal cord / glia
eye
taste / olfactory
otic / lateral line
epidermis
periderm
fin
ionocytes / mucous
pigment cells
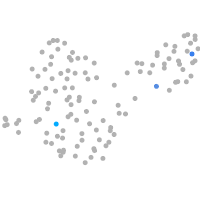
Expression by stage/cluster
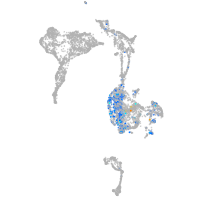
Correlated gene expression
Positive correlation
Negative correlation
Gene
r
Gene
r
apof
0.266
rplp2
-0.077
SLC22A7 (1 of many)
0.213
tcnbb
-0.073
FO704741.1
0.209
krtt1c19e
-0.066
pdgfrl
0.188
icn2
-0.060
si:ch1073-303k11.2
0.186
si:dkey-247k7.2
-0.057
ggctb
0.179
wu:fa03e10
-0.056
si:dkeyp-106c3.1
0.175
selenow2b
-0.054
si:ch73-86n18.1
0.173
si:ch211-207n23.2
-0.052
cfi
0.167
eevs
-0.051
zgc:158423
0.147
rps29
-0.050
ndnfl
0.145
selenow1
-0.050
soul5
0.142
rpl36a
-0.048
atp1b4
0.140
eef1da
-0.046
igfbp2a
0.139
si:dkeyp-51b9.3
-0.044
foxc1a
0.139
si:dkey-151g10.6
-0.042
ednraa
0.139
fut9d
-0.042
dcn
0.138
caspb
-0.040
nid1b
0.134
rpl38
-0.039
tgfbi
0.133
rpl36
-0.039
serpinh1b
0.130
tlcd1
-0.039
lamc3
0.129
rpl24
-0.039
foxd2
0.126
rpl31
-0.039
krt18a.1
0.123
si:dkeyp-1h4.6
-0.038
ramp2
0.122
rpl27
-0.038
flvcr2b
0.120
rpl34
-0.038
si:ch1073-205c8.5
0.119
rhcga
-0.038
si:ch211-197h24.8
0.117
scel
-0.038
olfml3b
0.117
uba52
-0.037
krt92
0.114
nme2b.1
-0.037
ntd5
0.113
si:dkey-248g15.3
-0.037
fstl1a
0.112
rpl28
-0.037
colec12
0.111
rhbg
-0.036
si:ch1073-155h21.1
0.110
si:dkey-202l22.6
-0.036
BX571681.5
0.110
rpl37
-0.036
ca6
0.107
cdc34a
-0.036