Daniocell
tfe3b (otic / lateral line)
transcription factor binding to IGHM enhancer 3b
ZFIN
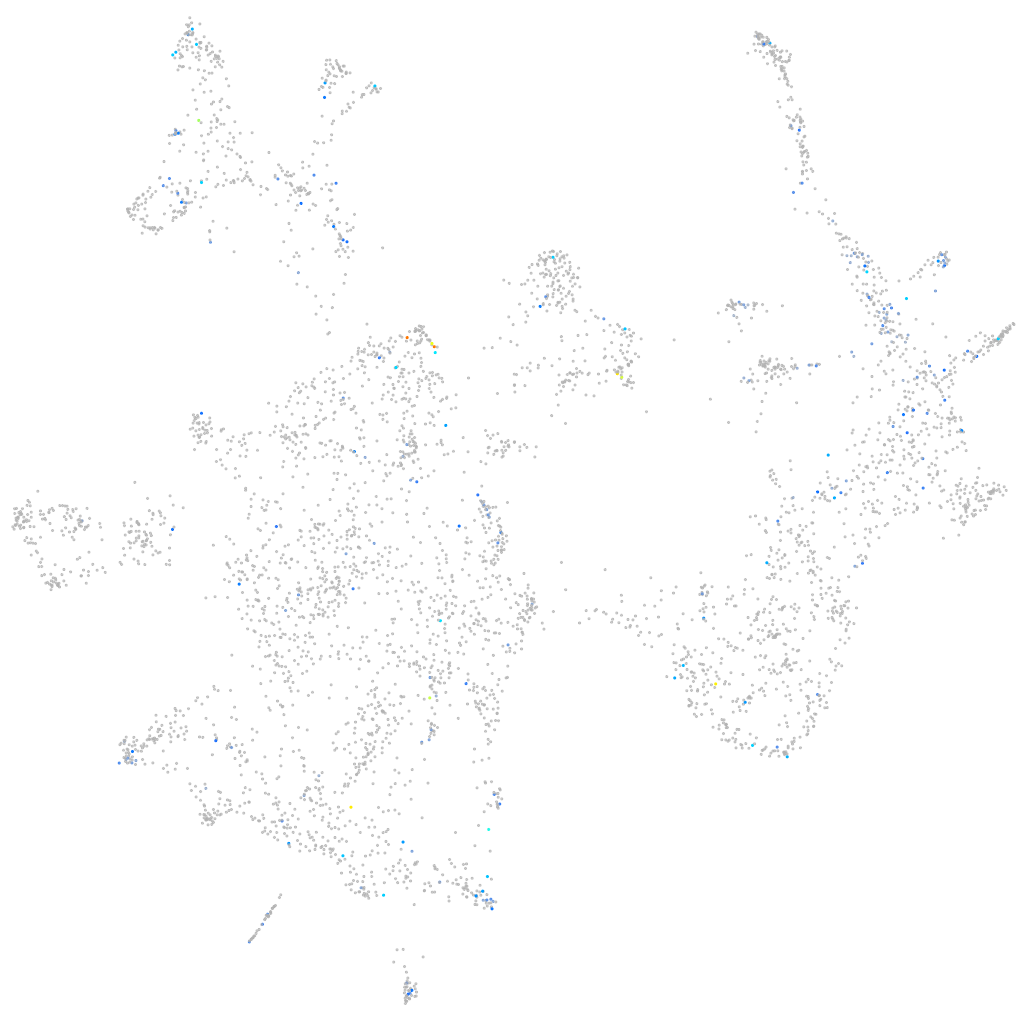
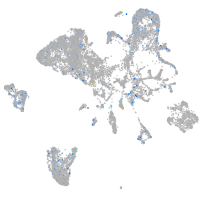
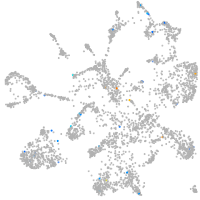
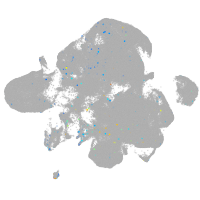
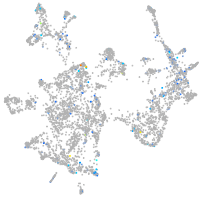
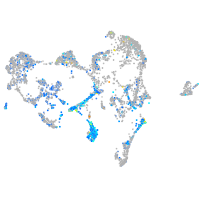
Gene expression UMAP
Display:
Expression
Stage
Other cell groups
all cells
blastomeres
PGCs
endoderm
axial mesoderm
muscle
mural cells /
non-skeletal muscle
mesenchyme
hematopoietic /
vasculature
pronephros
neural
spinal cord / glia
eye
taste / olfactory
otic / lateral line
epidermis
periderm
fin
ionocytes / mucous
pigment cells
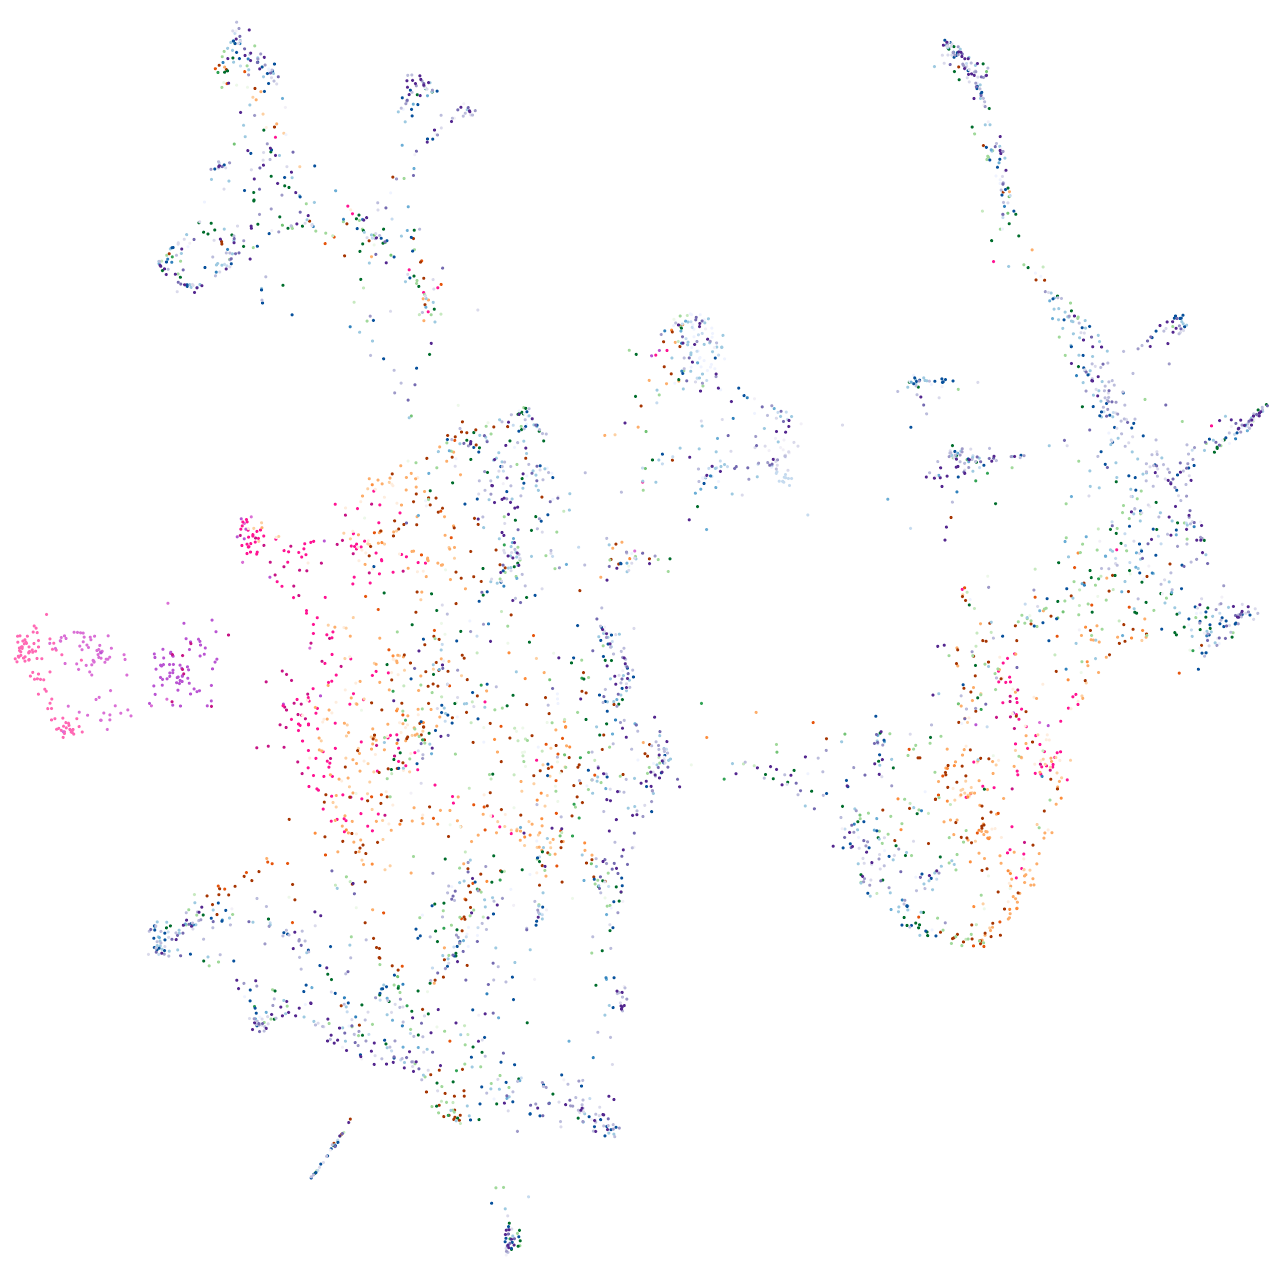
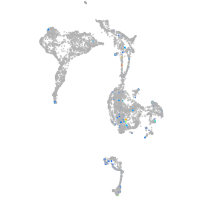
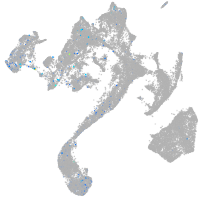
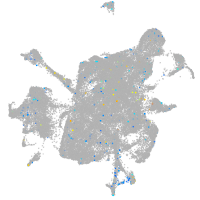
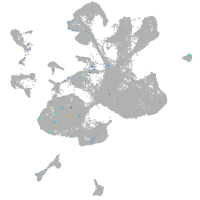
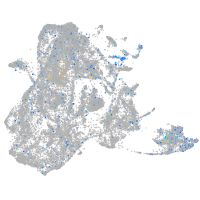
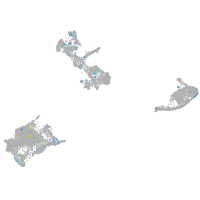
Expression by stage/cluster
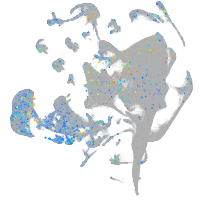
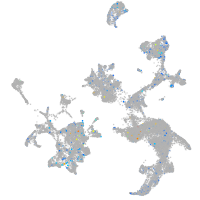
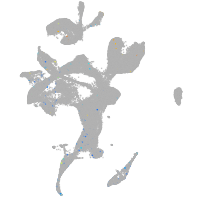
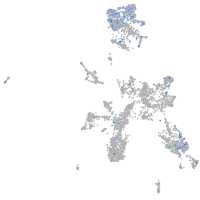
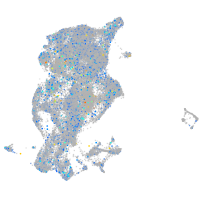
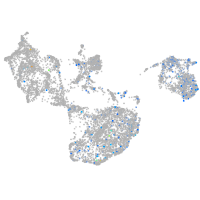
Correlated gene expression
Positive correlation
Negative correlation
Gene
r
Gene
r
XLOC-024725
0.218
hnrnpa0l
-0.086
BX465834.1
0.217
rpl21
-0.081
si:dkey-237g15.2
0.205
si:ch211-222l21.1
-0.080
si:ch211-132g1.4
0.187
hmga1a
-0.080
XLOC-019908
0.187
h2afvb
-0.078
hnf1bb
0.185
ybx1
-0.078
XLOC-036686
0.179
ptmab
-0.077
zgc:152904
0.177
eef1b2
-0.077
LOC110439375
0.171
rpl39
-0.075
fgf11a
0.170
h3f3d
-0.075
CR385053.2
0.165
rpl22l1
-0.074
LOC108179989
0.165
khdrbs1a
-0.073
LOC110440040
0.162
rps5
-0.073
si:dkey-29m1.2
0.160
hnrnpaba
-0.071
CU302321.1
0.156
si:ch211-288g17.3
-0.071
si:dkey-193n17.9
0.155
cirbpb
-0.070
XLOC-041356
0.154
rpl30
-0.069
il7r
0.153
rbm8a
-0.068
pimr110
0.148
apex1
-0.068
si:dkey-172o19.2
0.141
hmgn2
-0.068
LOC110439997
0.138
tmeff1b
-0.067
LOC103910625
0.137
rpl35
-0.067
cmlc1
0.136
rps7
-0.067
XLOC-035540
0.135
lsm6
-0.067
pnoca
0.132
rpl11
-0.067
pmchl
0.132
rpl10a
-0.066
ssx2ipb
0.132
nop10
-0.066
LOC100330283
0.131
rps2
-0.066
galnt17
0.131
snrpe
-0.065
si:ch211-255i20.3
0.131
nutf2
-0.065
BX005073.1
0.130
rps23
-0.065
BX005417.1
0.128
npm1a
-0.064
foxf2b
0.128
rpl5a
-0.064
LOC101884045
0.127
rpsa
-0.064
CR381686.4
0.124
rps16
-0.064