Daniocell
tcte1 (pigment cells)
t-complex-associated-testis-expressed 1
ZFIN
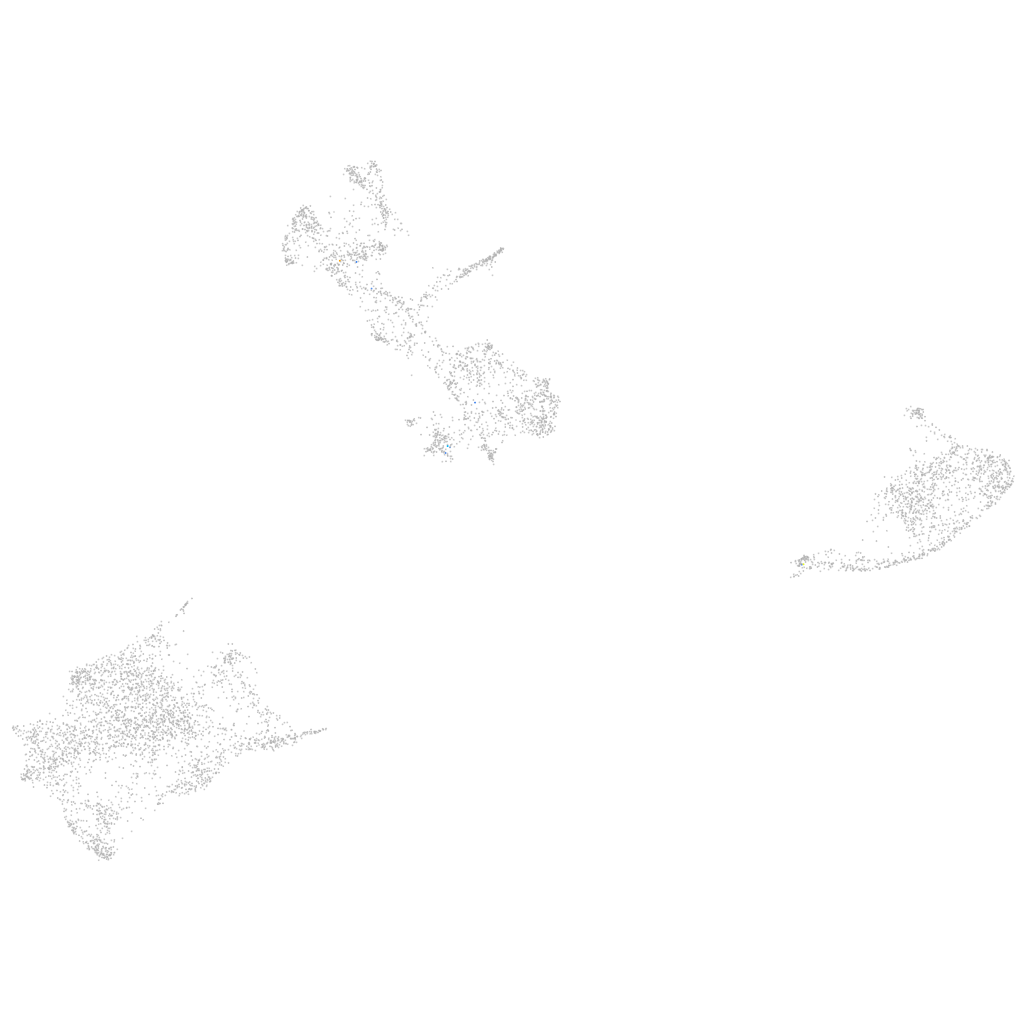
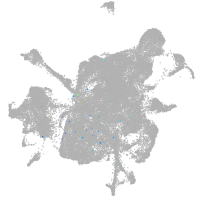
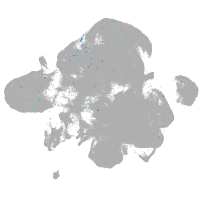
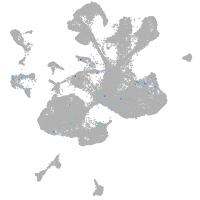
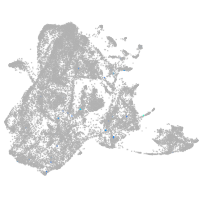
Gene expression UMAP
Display:
Expression
Stage
Other cell groups
all cells
blastomeres
PGCs
endoderm
axial mesoderm
muscle
mural cells /
non-skeletal muscle
mesenchyme
hematopoietic /
vasculature
pronephros
neural
spinal cord / glia
eye
taste / olfactory
otic / lateral line
epidermis
periderm
fin
ionocytes / mucous
pigment cells
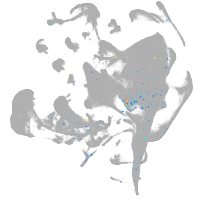
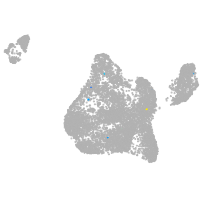
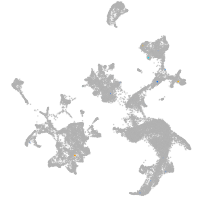
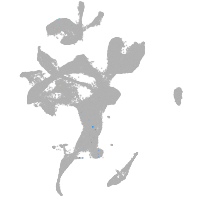
Expression by stage/cluster
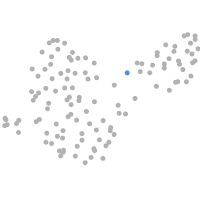
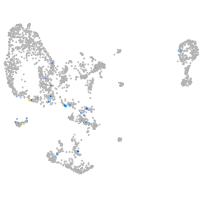
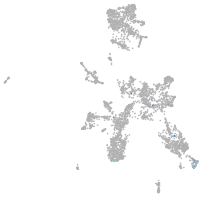
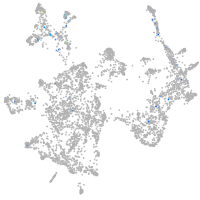
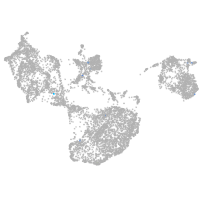
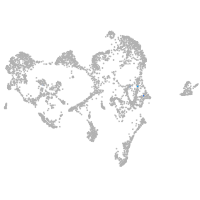
Correlated gene expression
Positive correlation
Negative correlation
Gene
r
Gene
r
BX927122.1
0.548
gch2
-0.028
LOC101886486
0.382
akr1b1
-0.026
drd1a
0.325
actc1b
-0.025
CR376738.2
0.325
uraha
-0.023
tuft1b
0.311
slc22a7a
-0.022
CABZ01071972.1
0.272
CABZ01021592.1
-0.022
nitr4a
0.267
zgc:153867
-0.022
ddhd1a
0.248
pfn1
-0.022
XLOC-026765
0.246
si:dkey-56m19.5
-0.022
znf1073
0.224
gstp1
-0.021
FP102806.1
0.197
si:dkey-251i10.2
-0.021
BX629344.1
0.186
actb2
-0.020
plppr3b
0.178
gpd1b
-0.019
LOC101884172
0.170
nupr1a
-0.019
LOC110439889
0.163
mylpfa
-0.019
atp7b
0.160
tmem130
-0.019
si:ch211-222n22.1
0.159
hbae3
-0.019
kidins220a
0.158
rtn1b
-0.018
si:dkey-165b20.3
0.151
aqp3a
-0.018
sdhda
0.146
TMEM19
-0.018
LOC101886654
0.145
cotl1
-0.018
XLOC-022776
0.145
prdx1
-0.018
si:ch211-38m6.7
0.145
cyt1
-0.018
LOC108179634
0.144
phyhd1
-0.018
mpp4a
0.143
aox5
-0.017
ptprt
0.142
icn
-0.017
XLOC-032912
0.139
cyt1l
-0.017
BX936433.2
0.132
pts
-0.017
CR352218.1
0.132
hbae1.1
-0.017
LOC110438331
0.132
krt4
-0.016
ptger1b
0.132
si:dkey-204f11.64
-0.016
immp1l
0.131
bscl2l
-0.016
l3mbtl3
0.128
cd63
-0.016
ap4m1
0.127
bco1
-0.016
rhogd
0.126
elocb
-0.016