Daniocell
tbcc (axial mesoderm)
tubulin folding cofactor C
ZFIN
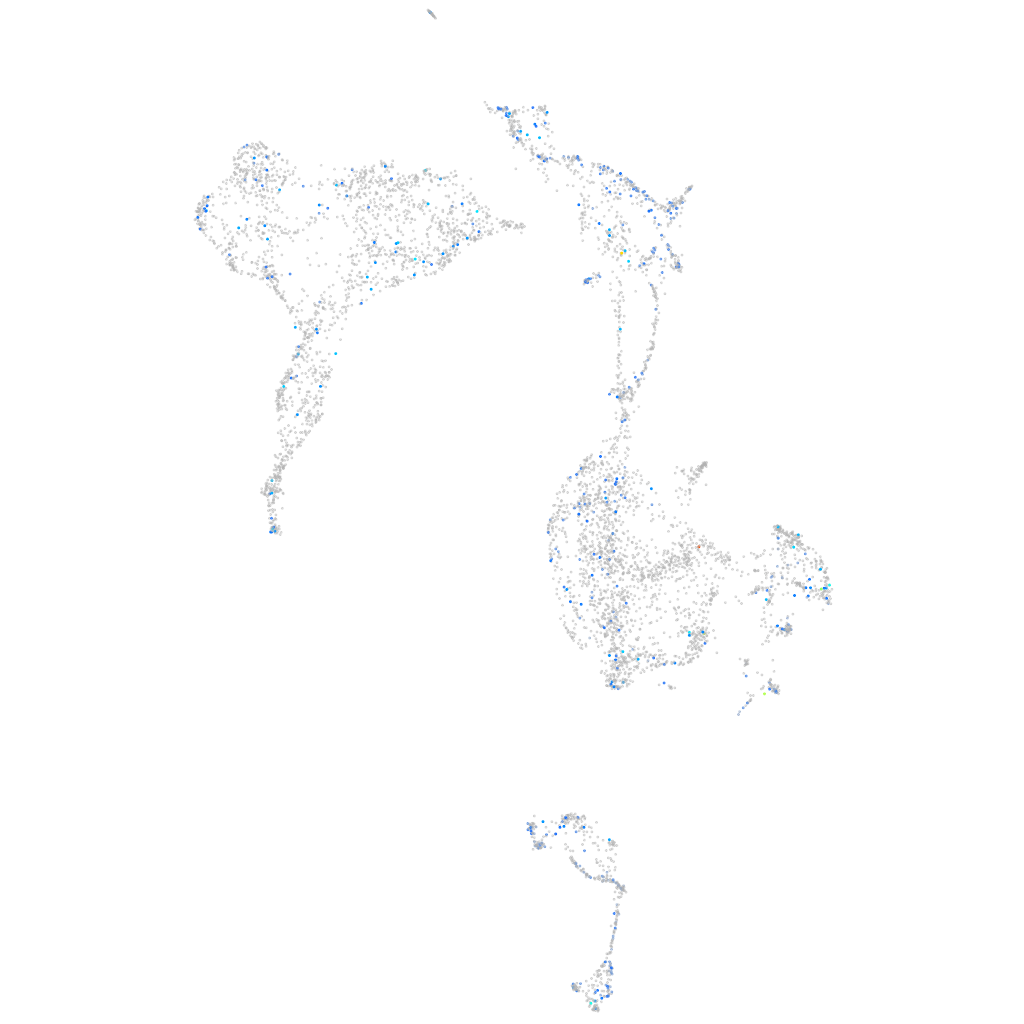
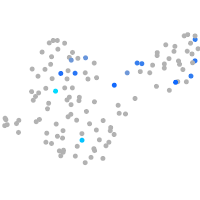
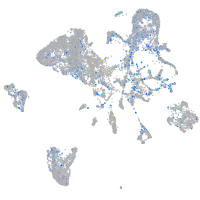
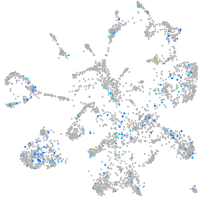
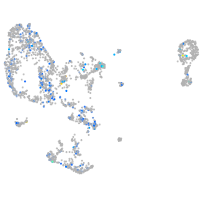
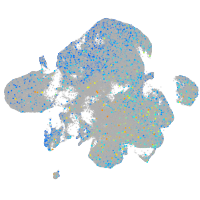
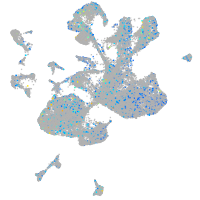
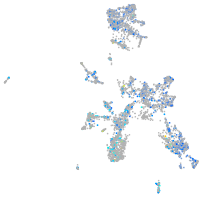
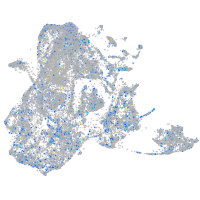
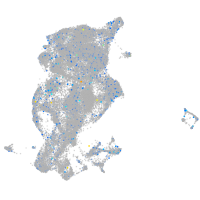
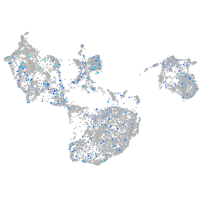
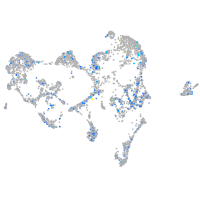
Gene expression UMAP
Display:
Expression
Stage
Other cell groups
all cells
blastomeres
PGCs
endoderm
axial mesoderm
muscle
mural cells /
non-skeletal muscle
mesenchyme
hematopoietic /
vasculature
pronephros
neural
spinal cord / glia
eye
taste / olfactory
otic / lateral line
epidermis
periderm
fin
ionocytes / mucous
pigment cells
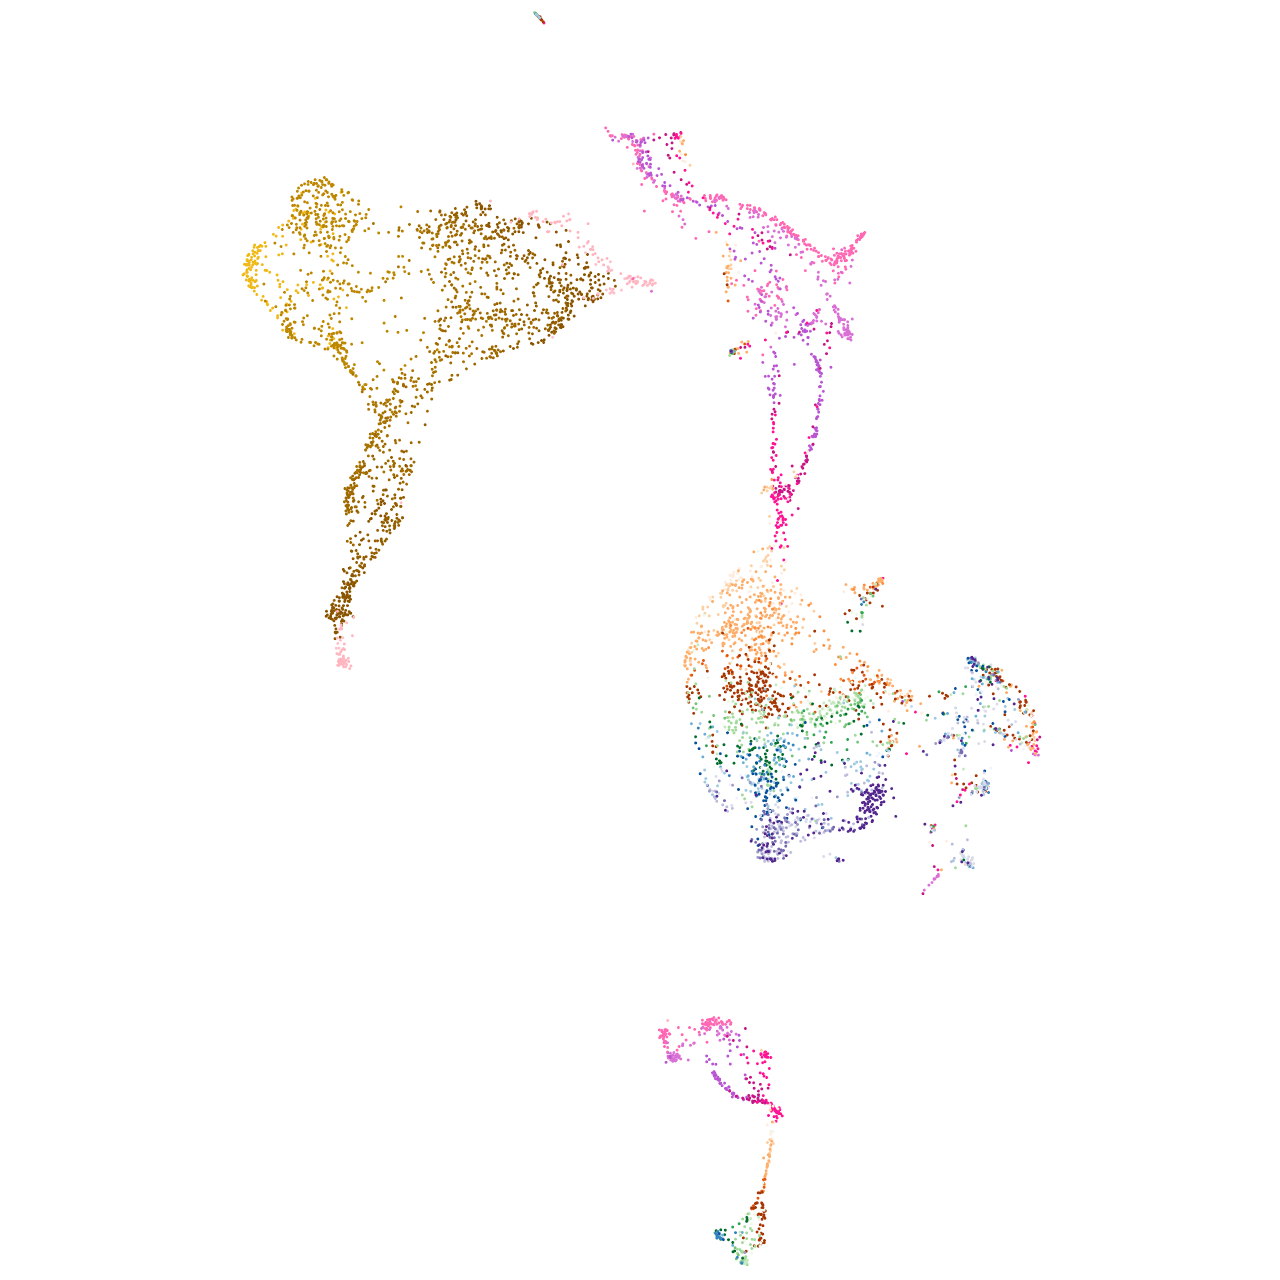
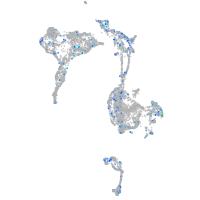
Expression by stage/cluster
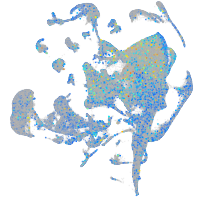
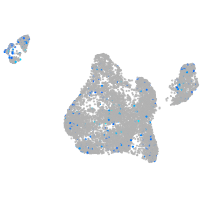
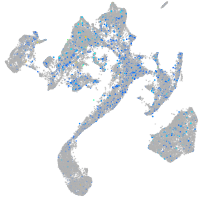
Correlated gene expression
Positive correlation
Negative correlation
Gene
r
Gene
r
si:dkey-19b23.10
0.210
NC-002333.4
-0.054
CABZ01075521.1
0.190
col11a2
-0.052
prf1.5
0.161
epyc
-0.047
si:ch211-130h14.6
0.150
stm
-0.046
slc8a3
0.146
chad
-0.046
zgc:77375
0.140
sdc2
-0.045
zgc:153317
0.135
si:ch211-152c2.3
-0.045
trpm3
0.121
AL929222.2
-0.045
si:ch73-103b9.2
0.120
si:dkeyp-69c1.6
-0.044
elovl8a
0.119
matn3a
-0.042
BX663520.1
0.114
thbs1b
-0.042
ube3d
0.105
CU074419.2
-0.042
rtn4rl1a
0.102
zmp:0000000624
-0.042
c4b
0.101
thrap3b
-0.041
si:dkeyp-2e4.5
0.100
matr3l1.1
-0.041
cct2
0.100
si:dkey-92i17.2
-0.041
LOC110440217
0.096
si:dkey-31g6.6
-0.040
LOC110438006
0.094
matn3b
-0.040
BX640549.1
0.094
ust
-0.039
vdac2
0.094
si:dkey-234i14.3
-0.039
commd8
0.091
cnmd
-0.039
zgc:56493
0.091
zgc:113232
-0.039
LOC103911653
0.090
chadla
-0.039
gfra3
0.090
hnrnpm
-0.038
znf1127
0.088
col9a3
-0.038
rab1ab
0.087
ucmab
-0.038
znf972
0.087
tgfbi
-0.038
LOC101885675
0.086
cspg4
-0.038
klf6a
0.086
si:dkey-19e4.5
-0.038
psen2
0.085
snorc
-0.037
ndufb10
0.085
ncl
-0.037
si:dkey-222f8.3
0.085
srrt
-0.037
BX908780.2
0.085
si:ch73-23l24.1
-0.037
hnrnpa0l
0.085
col9a1b
-0.036
CR388102.1
0.084
ddx46
-0.036