Daniocell
tagapa (glial cells / spinal cord)
T cell activation RhoGTPase activating protein a
ZFIN
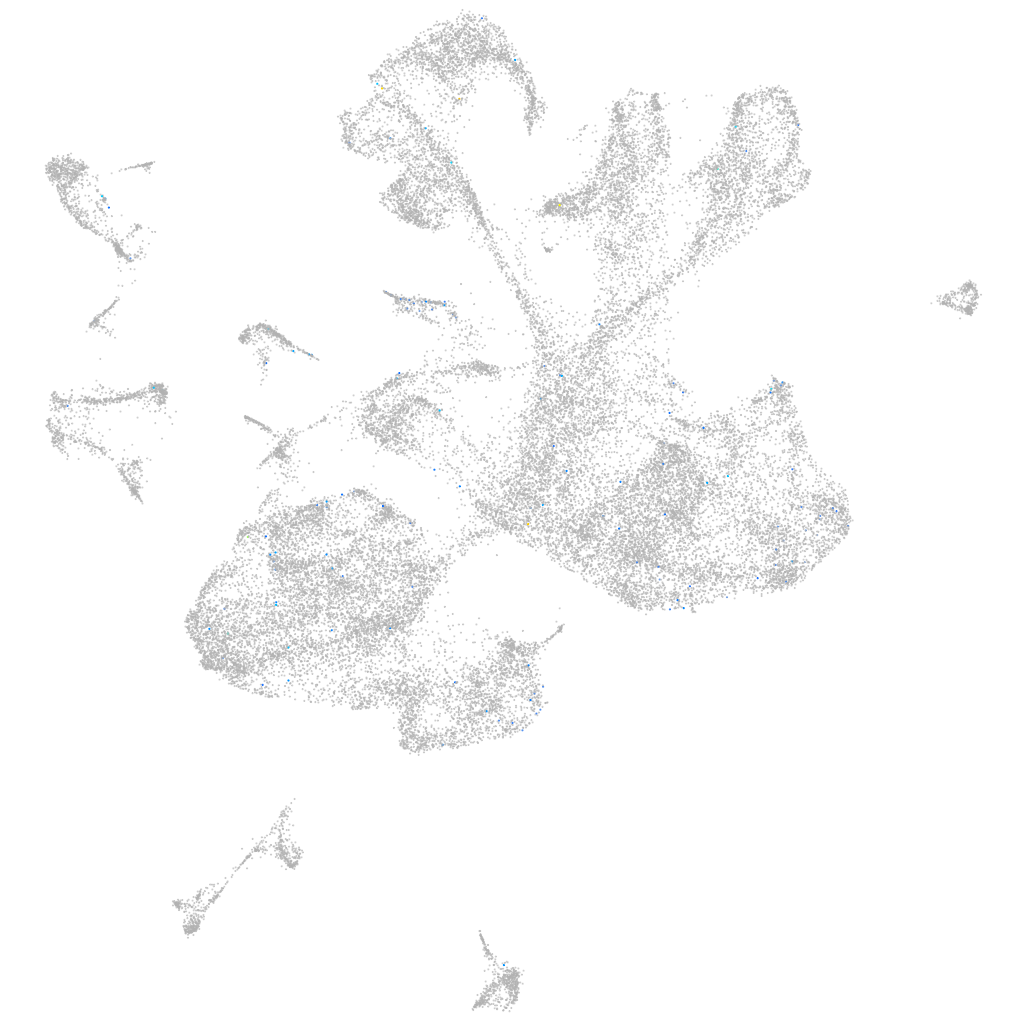
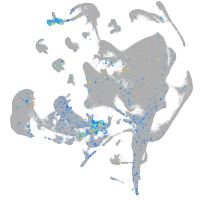
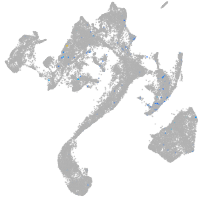
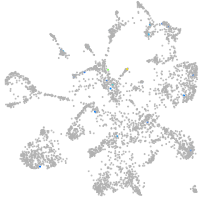
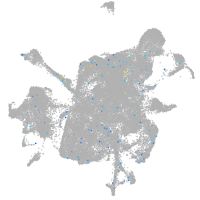
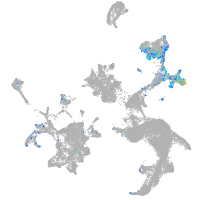
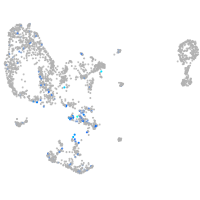
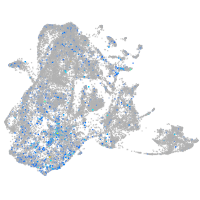
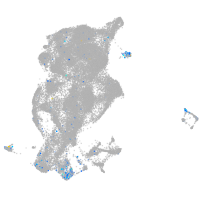
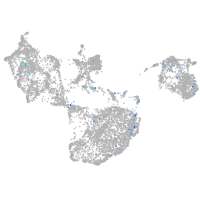
Gene expression UMAP
Display:
Expression
Stage
Other cell groups
all cells
blastomeres
PGCs
endoderm
axial mesoderm
muscle
mural cells /
non-skeletal muscle
mesenchyme
hematopoietic /
vasculature
pronephros
neural
spinal cord / glia
eye
taste / olfactory
otic / lateral line
epidermis
periderm
fin
ionocytes / mucous
pigment cells
Expression by stage/cluster
Correlated gene expression
Positive correlation
Negative correlation
Gene
r
Gene
r
BX927234.1
0.154
fabp3
-0.021
XLOC-017416
0.137
hmgb1a
-0.020
XLOC-023372
0.124
bcl2l10
-0.018
LOC103909419
0.124
tmsb
-0.018
CR749763.2
0.097
slc40a1
-0.018
BX908757.3
0.095
rtn1a
-0.018
bsnd
0.092
nova2
-0.017
pimr72
0.091
elavl3
-0.017
LOC108191726
0.090
si:ch73-21g5.7
-0.016
si:dkey-79f11.7
0.087
tmeff1b
-0.016
CABZ01078858.1
0.084
si:dkey-56f14.7
-0.016
XLOC-023847
0.081
hapln1a
-0.015
lim2.5
0.079
epb41a
-0.015
LOC101885283
0.078
si:dkey-276j7.1
-0.015
foxe1
0.078
map2
-0.015
LOC103909937
0.075
myt1b
-0.014
LOC103909948
0.074
cnot6a
-0.014
BX942819.3
0.074
rpl29
-0.014
rdh1
0.071
onecut1
-0.014
LOC110437921
0.071
si:dkey-56m19.5
-0.014
LOC110439943
0.070
crebzf
-0.014
XLOC-015422
0.069
sh3bgrl3
-0.014
aqp8a.2
0.063
baz2ba
-0.014
c24h18orf63
0.060
ube2d4
-0.014
BX276128.1
0.059
zgc:92140
-0.014
CR388417.1
0.058
ptmab
-0.014
LOC100537585
0.056
hmgb1b
-0.014
si:zfos-1897c11.1
0.052
si:ch73-1a9.3
-0.013
ptger1b
0.052
h3f3a
-0.013
si:dkey-117a8.1
0.052
dpysl4
-0.013
LOC110439634
0.052
tnrc6c2
-0.013
taar18b
0.051
scrt1a
-0.013
slc22a2
0.051
rab1bb
-0.013
LOC797305
0.049
ip6k2a
-0.013
FP015866.3
0.047
gabarapa
-0.013