Daniocell
styxl1 (pronephros)
serine/threonine/tyrosine interacting-like 1
ZFIN
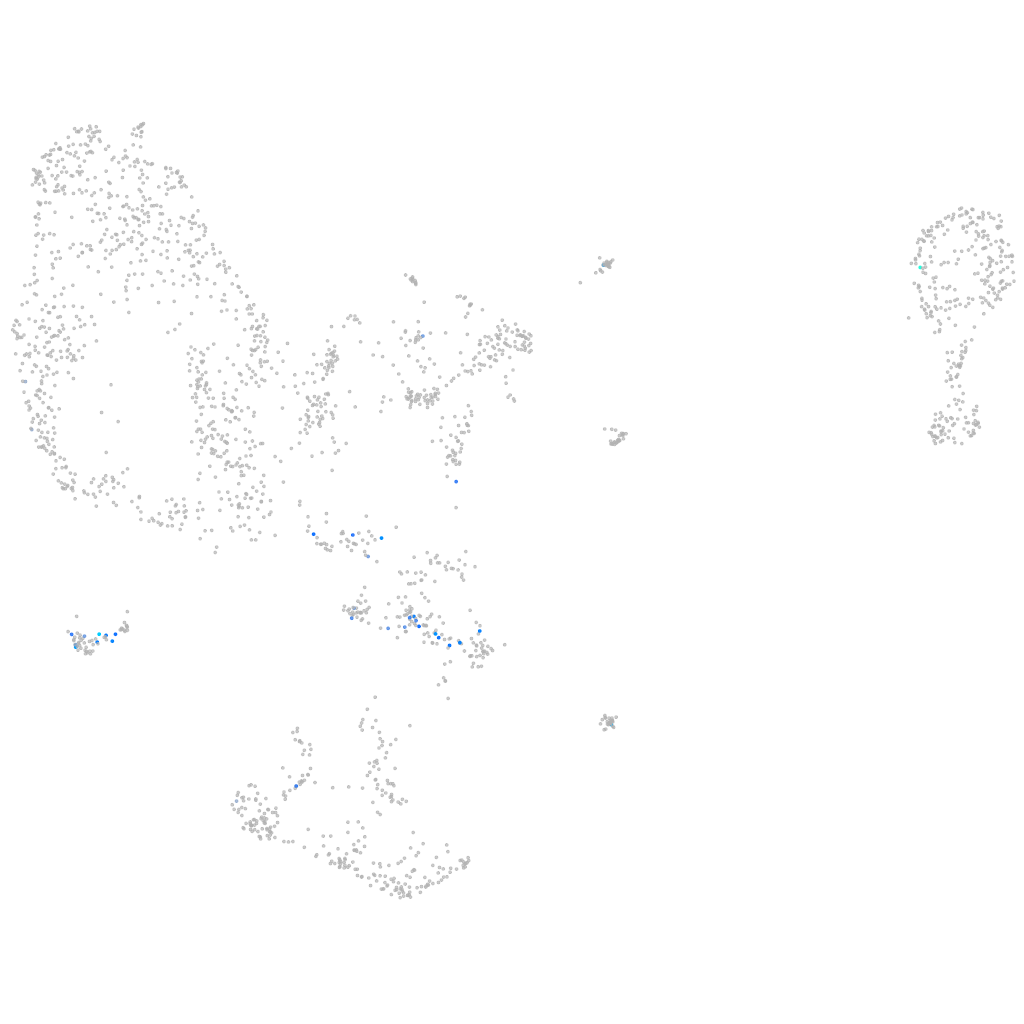
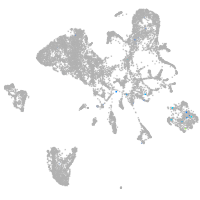
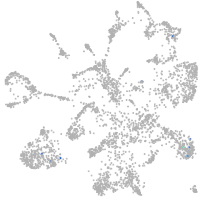
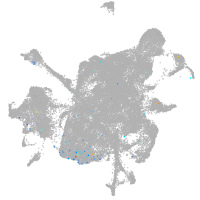
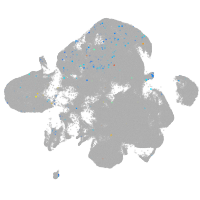
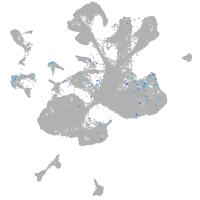
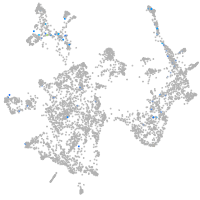
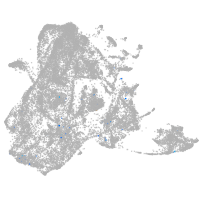
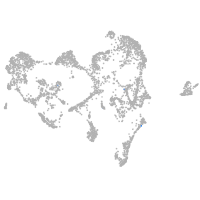
Gene expression UMAP
Display:
Expression
Stage
Other cell groups
all cells
blastomeres
PGCs
endoderm
axial mesoderm
muscle
mural cells /
non-skeletal muscle
mesenchyme
hematopoietic /
vasculature
pronephros
neural
spinal cord / glia
eye
taste / olfactory
otic / lateral line
epidermis
periderm
fin
ionocytes / mucous
pigment cells
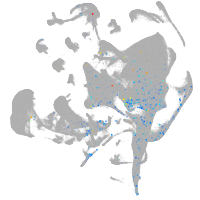
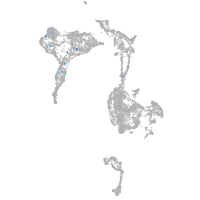
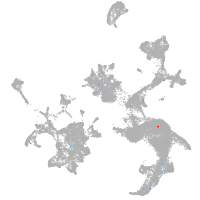
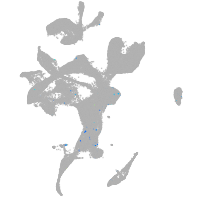
Expression by stage/cluster
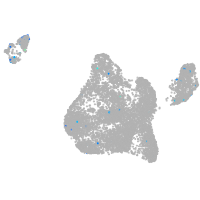
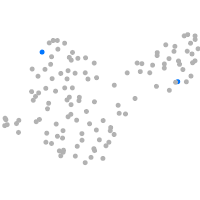
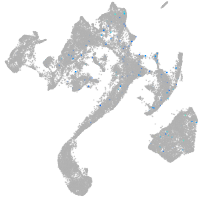
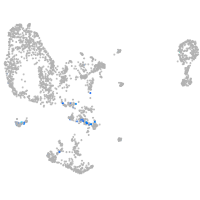
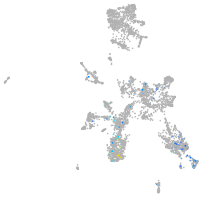
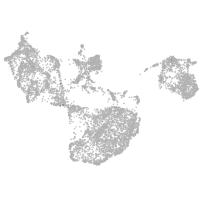
Correlated gene expression
Positive correlation
Negative correlation
Gene
r
Gene
r
CABZ01066578.1
0.375
aldob
-0.100
qdprb2
0.371
si:ch211-139a5.9
-0.094
LOC103910749
0.352
gapdh
-0.092
gzm3.2
0.317
cdaa
-0.090
btg4
0.301
upb1
-0.087
BX530079.1
0.297
dab2
-0.086
pla2g3
0.280
cox6a2
-0.084
si:ch211-272b8.6
0.270
glud1b
-0.083
si:ch211-186j3.3
0.270
pdzk1ip1
-0.083
BX511023.1
0.268
hao1
-0.082
cfap299
0.267
si:dkey-194e6.1
-0.081
fam166b
0.265
adh8b
-0.081
si:ch211-197n1.2
0.254
grhprb
-0.080
tsga10
0.253
ahcy
-0.079
zgc:112416
0.248
eno3
-0.079
trhr2
0.244
gcshb
-0.078
LOC100329490
0.242
suclg2
-0.078
lmod2a
0.240
eps8l3a
-0.077
LOC100537297
0.238
fbp1b
-0.077
kcnj1a.2
0.235
rplp2
-0.077
tppp3
0.233
si:dkey-33i11.9
-0.077
thegl
0.232
si:dkey-16p21.8
-0.077
CR788303.1
0.231
si:dkey-28n18.9
-0.076
si:ch73-22a13.3
0.231
aldh7a1
-0.076
LOC103911994
0.231
slc26a1
-0.076
nog5
0.231
ahcyl1
-0.075
si:ch211-243a20.4
0.231
zgc:136493
-0.075
FP015808.1
0.229
dpys
-0.074
miip
0.227
cubn
-0.074
ccdc153
0.227
gstr
-0.073
rsph9
0.224
gpt2l
-0.073
odf3l2b
0.220
fahd1
-0.073
cfap52
0.218
nit2
-0.073
si:ch1073-416d2.4
0.218
aldh6a1
-0.073
ribc2
0.216
tpi1b
-0.073