Daniocell
stam (fin)
signal transducing adaptor molecule (SH3 domain and ITAM motif) 1
ZFIN
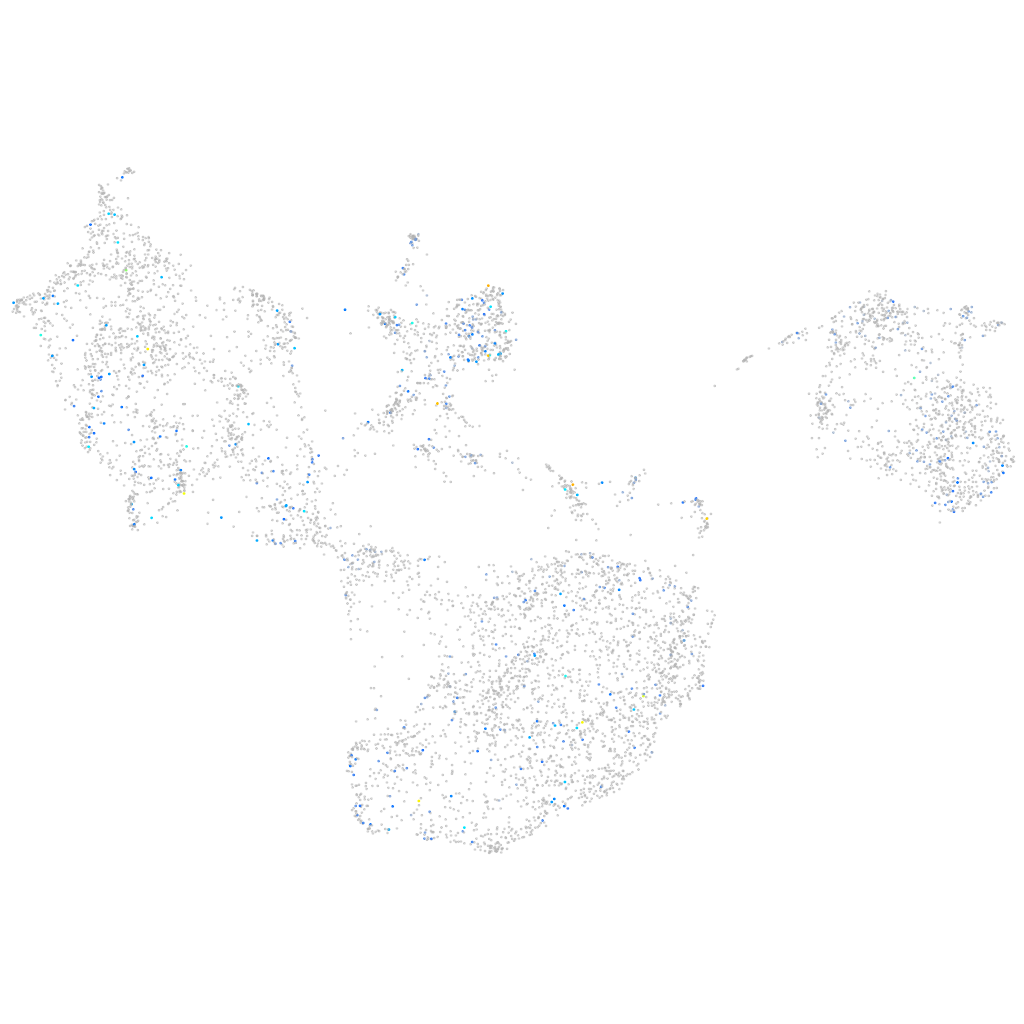
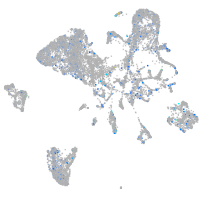
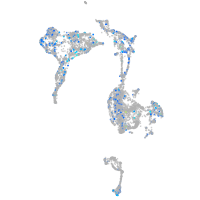
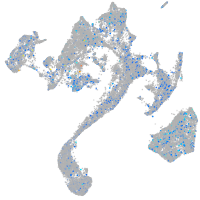
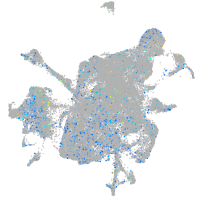
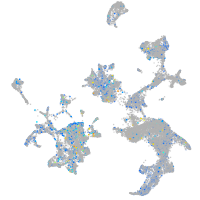
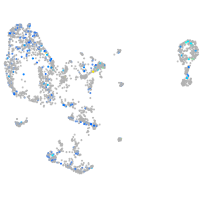
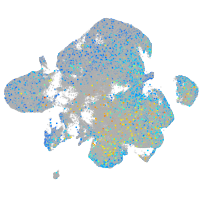
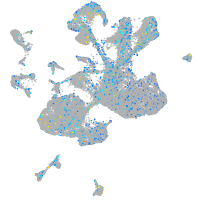
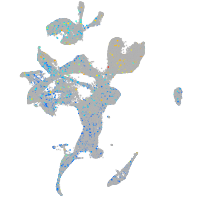
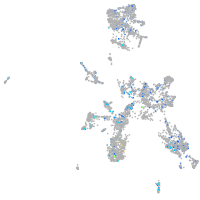
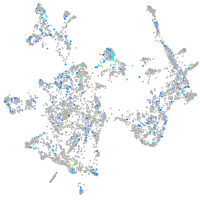
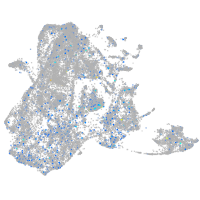
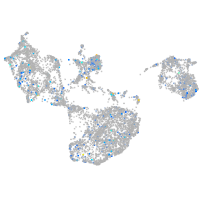
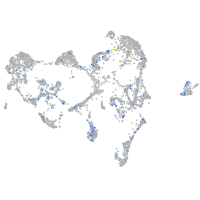
Gene expression UMAP
Display:
Expression
Stage
Other cell groups
all cells
blastomeres
PGCs
endoderm
axial mesoderm
muscle
mural cells /
non-skeletal muscle
mesenchyme
hematopoietic /
vasculature
pronephros
neural
spinal cord / glia
eye
taste / olfactory
otic / lateral line
epidermis
periderm
fin
ionocytes / mucous
pigment cells
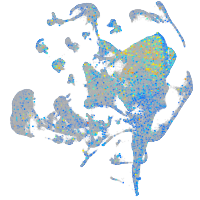
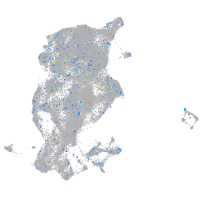
Expression by stage/cluster
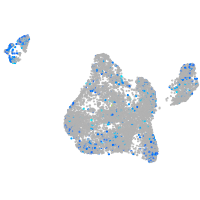
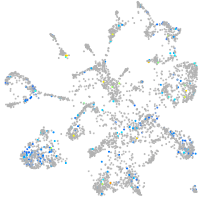
Correlated gene expression
Positive correlation
Negative correlation
Gene
r
Gene
r
si:busm1-266f07.2
0.163
cyt1
-0.054
chrna2b
0.133
krt4
-0.049
fam20ca
0.132
gamt
-0.048
wasb
0.132
krt91
-0.048
LOC100535200
0.131
krt5
-0.045
LOC108183785
0.129
cyt1l
-0.044
XLOC-026454
0.128
cfl1l
-0.044
kcna3a
0.126
rbp4
-0.043
AL954669.1
0.124
s100a10b
-0.043
AL954767.1
0.124
igfbp2a
-0.042
CU104741.1
0.123
anxa1a
-0.041
cyb561a3b
0.119
tmsb1
-0.041
zmp:0000000845
0.116
cebpd
-0.040
tmsb2
0.116
col11a1a
-0.039
tmie
0.114
itgb4
-0.039
plek
0.110
cldn1
-0.038
CR626902.1
0.109
pfn1
-0.038
BX294181.2
0.109
krtt1c19e
-0.038
map1aa
0.109
rps5
-0.037
kcnd1
0.107
gsta.1
-0.037
adarb2
0.107
cavin1b
-0.036
LOC100331751
0.106
si:dkey-16p21.8
-0.036
zgc:100920
0.106
pycard
-0.036
trpm1b
0.105
zgc:136930
-0.035
CR293531.2
0.104
cebpb
-0.035
KCNIP1
0.104
hic2
-0.035
znf1121
0.103
col28a2a
-0.034
LOC101885599
0.103
rpl29
-0.034
smpd1
0.103
zgc:77439
-0.033
si:dkeyp-68b7.10
0.102
si:dkey-33c14.3
-0.033
si:dkey-26c10.5
0.102
itgb1b.2
-0.032
si:dkeyp-7a3.1
0.102
mthfs
-0.032
nlrc6
0.102
tmsb4x
-0.031
zgc:112408
0.102
spaca4l
-0.031
pou2f2a
0.101
col7a1
-0.031