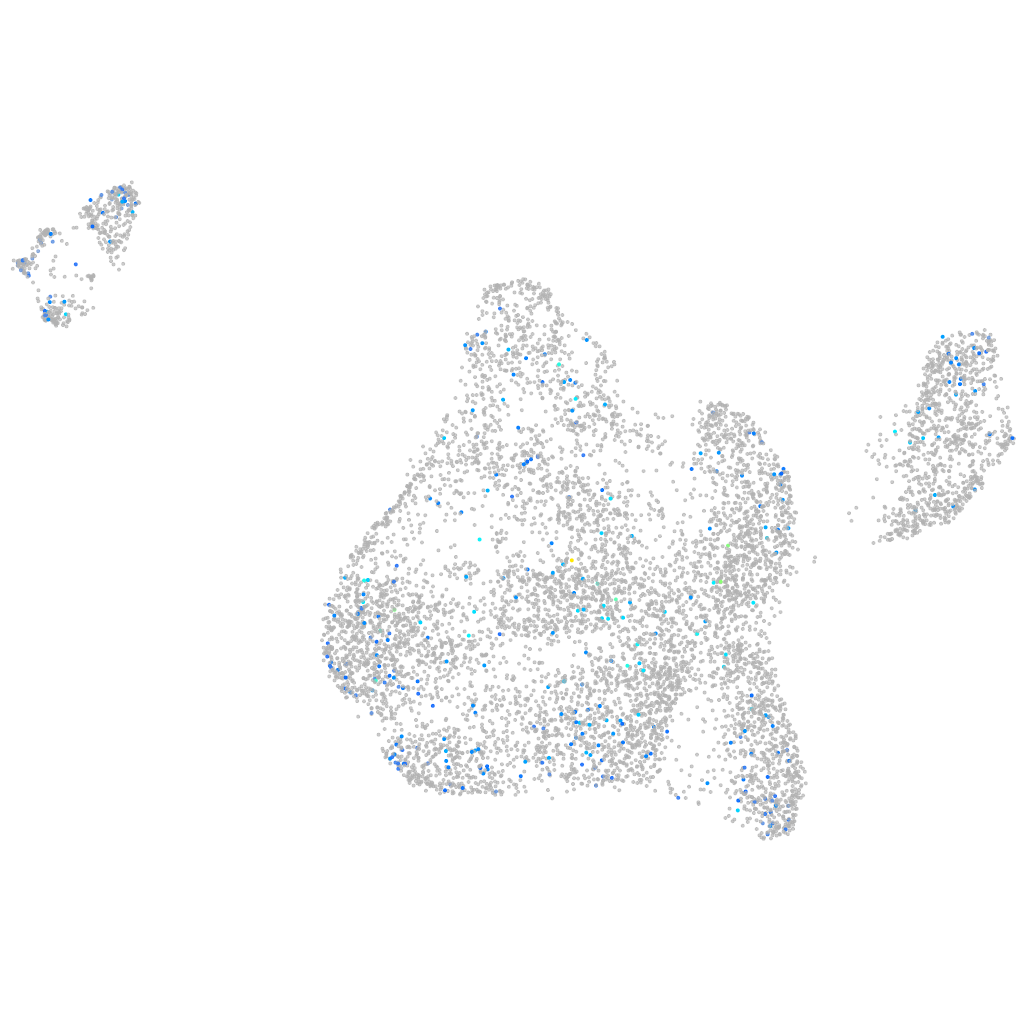
Daniocell
srrd (blastomeres)
SRR1 domain containing
ZFIN
Gene expression UMAP
Display:
Expression
Stage
Other cell groups
all cells
blastomeres
PGCs
endoderm
axial mesoderm
muscle
mural cells /
non-skeletal muscle
mesenchyme
hematopoietic /
vasculature
pronephros
neural
spinal cord / glia
eye
taste / olfactory
otic / lateral line
epidermis
periderm
fin
ionocytes / mucous
pigment cells
Expression by stage/cluster
Correlated gene expression
Positive correlation
Negative correlation
Gene
r
Gene
r
FP085398.1
0.106
NC-002333.4
-0.043
shha
0.103
ptmab
-0.034
LOC108190601
0.097
zcchc9
-0.030
stk24a
0.091
tmsb4x
-0.030
LOC110440167
0.089
eef1da
-0.030
LOC101885538
0.085
tmem127
-0.028
tmem125b
0.085
stm
-0.028
pdzk1
0.084
si:ch73-1a9.3
-0.027
cldn11a
0.084
akap12b
-0.027
si:dkey-27j5.8
0.082
top2b
-0.027
lgi2b
0.078
psma3
-0.027
LOC101883268
0.077
hmgb2a
-0.027
defbl1
0.077
kcnk6
-0.027
zgc:136908
0.077
si:ch211-166a6.5
-0.027
zgc:172271
0.076
erich2
-0.026
LOC108182812
0.072
zgc:114118
-0.026
CR589947.2
0.071
spry4
-0.026
zbtb32
0.071
hsd3b2
-0.026
zgc:174863
0.071
pfn1
-0.026
LOC110438179
0.070
fbxl3a
-0.025
XLOC-039113
0.069
ier2a
-0.025
LOC100535838
0.069
tln2a
-0.025
LOC100006926
0.069
myl12.1
-0.024
skor1b
0.067
nucks1a
-0.024
BX005245.1
0.065
trappc4
-0.024
BX897662.1
0.065
hnrnpa0b
-0.024
CR407594.1
0.065
notum1a
-0.024
prf1.5
0.065
gnai1
-0.023
slc2a9l1
0.065
ftr82
-0.023
rhobtb2a
0.064
noto
-0.023
LOC108191752
0.063
marcksl1b
-0.023
lingo2b
0.063
BX511034.1
-0.023
gpr31
0.063
si:ch73-281n10.2
-0.023
XLOC-043220
0.062
tjp1a
-0.023
slco1d1
0.062
hint1
-0.023