Daniocell
srbd1 (taste / olfactory)
S1 RNA binding domain 1
ZFIN
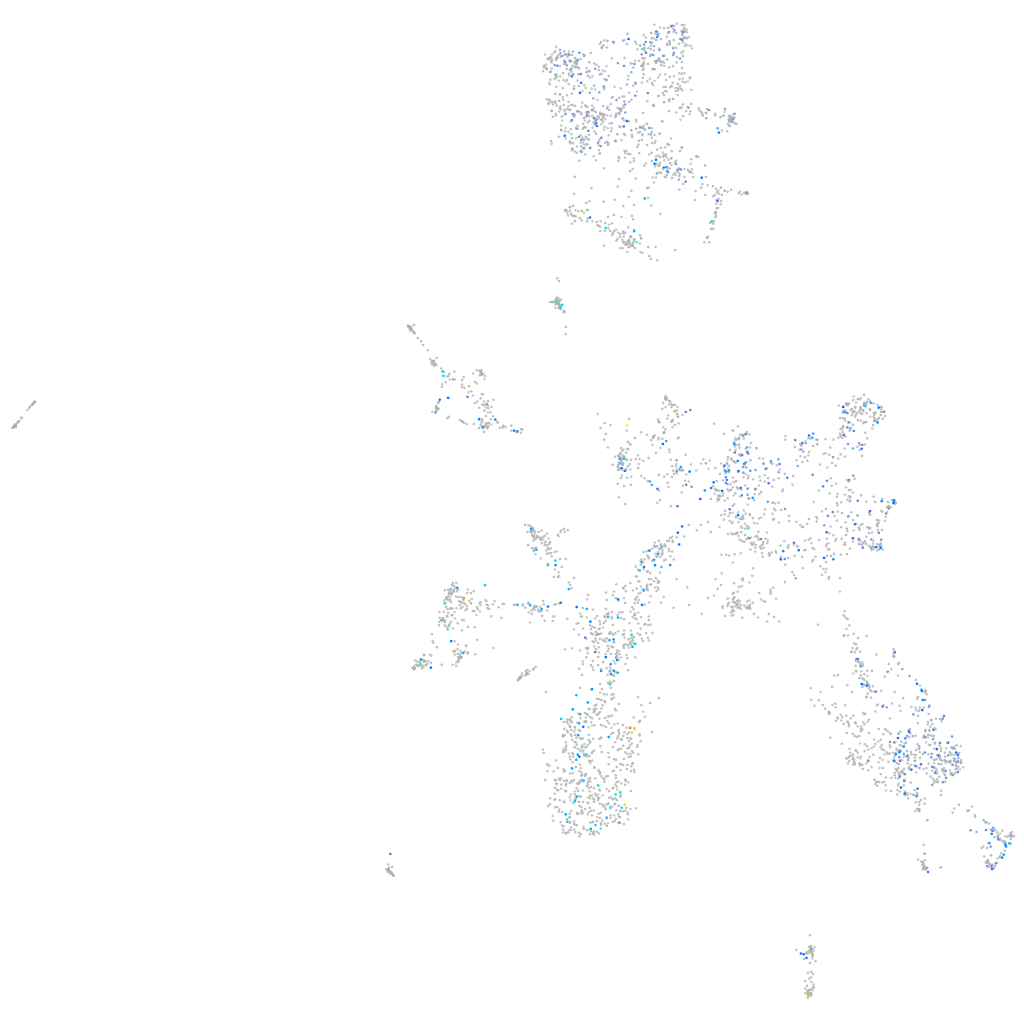
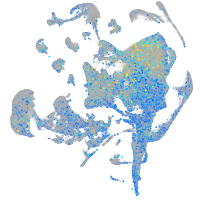
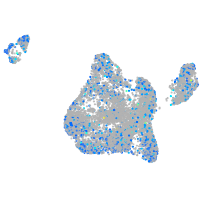
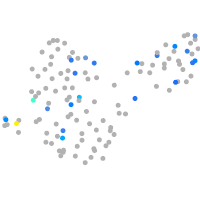
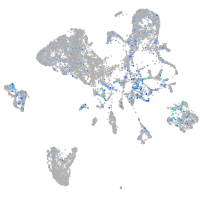
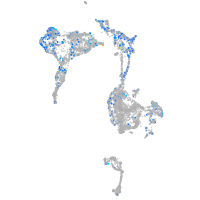
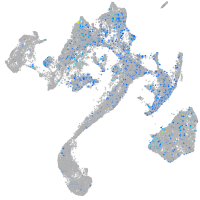
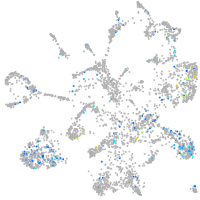
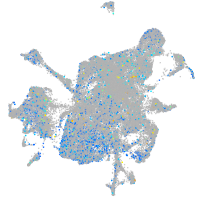
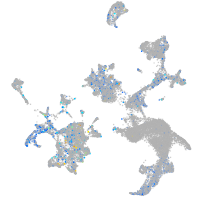
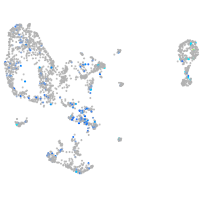
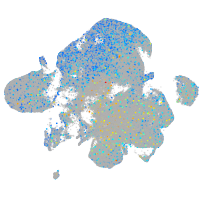
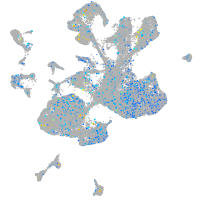
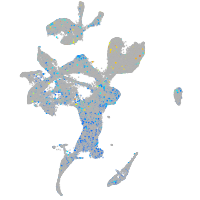
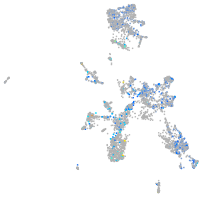
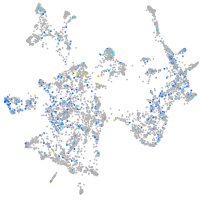
Gene expression UMAP
Display:
Expression
Stage
Other cell groups
all cells
blastomeres
PGCs
endoderm
axial mesoderm
muscle
mural cells /
non-skeletal muscle
mesenchyme
hematopoietic /
vasculature
pronephros
neural
spinal cord / glia
eye
taste / olfactory
otic / lateral line
epidermis
periderm
fin
ionocytes / mucous
pigment cells
Expression by stage/cluster
Correlated gene expression
Positive correlation
Negative correlation
Gene
r
Gene
r
LOC103911803
0.141
rpl36
-0.064
zgc:103681
0.125
ost4
-0.048
zgc:123299
0.123
rps21
-0.044
cbln11
0.119
spock2
-0.044
si:dkey-104n9.1
0.119
fbxl5
-0.042
CU457778.1
0.118
wu:fb18f06
-0.041
actn2b
0.116
pabpc1b
-0.040
lpar6a
0.112
fam177a1
-0.040
XLOC-019901
0.112
rho
-0.040
zgc:136605
0.111
ngrn
-0.040
XLOC-043782
0.109
klc3
-0.040
synpr
0.108
TIMM21
-0.039
laynb
0.108
si:dkey-112e7.2
-0.038
ddr2a
0.107
rdh10a
-0.038
lhx1b
0.103
icn
-0.037
XLOC-029634
0.103
ier2a
-0.037
AL935186.9.1
0.101
hbbe1.1
-0.037
itgae.1
0.100
cdip1
-0.036
LOC100330246
0.099
mapk12a
-0.036
FP016235.1
0.099
polr1a
-0.036
rin3
0.099
rpl29
-0.036
BX539336.1
0.098
plekha1a
-0.035
XLOC-000910
0.098
pcsk1
-0.035
pdha1b
0.098
cdc42ep4a
-0.035
LOC103911450
0.097
CABZ01090373.1
-0.035
si:ch211-196i2.1
0.096
nrxn2b
-0.035
XLOC-018363
0.096
tmem74
-0.035
htr1e
0.095
cdkal1
-0.035
XLOC-043174
0.095
tsc22d2
-0.035
zgc:55888
0.095
nck1a
-0.035
XLOC-028703
0.094
camk2n2
-0.034
asmt2
0.093
pkp3b
-0.034
LOC103908901
0.093
sft2d2b
-0.034
tmem129
0.091
tspan4a
-0.034
XLOC-031121
0.090
cox7c
-0.034