Daniocell
sqor (mural cells / non-skeletal muscle)
sulfide quinone oxidoreductase
ZFIN
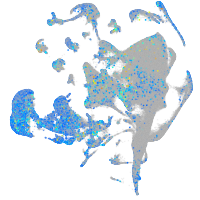
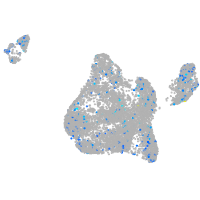
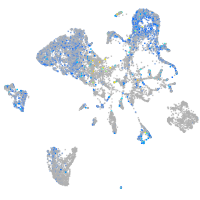
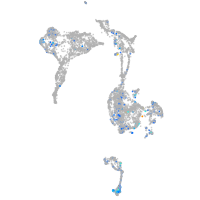
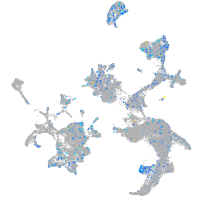
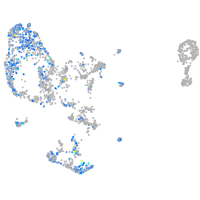
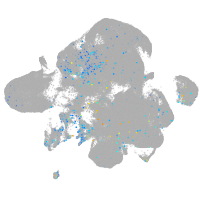
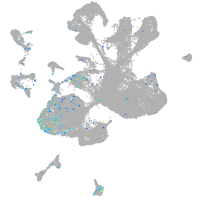
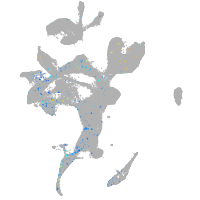
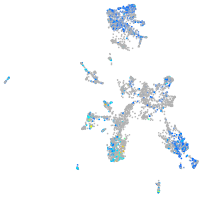
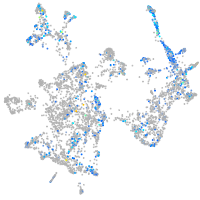
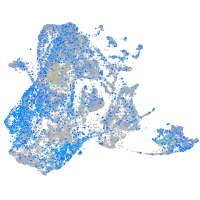
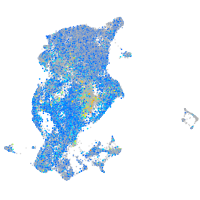
Gene expression UMAP
Display:
Expression
Stage
Other cell groups
all cells
blastomeres
PGCs
endoderm
axial mesoderm
muscle
mural cells /
non-skeletal muscle
mesenchyme
hematopoietic /
vasculature
pronephros
neural
spinal cord / glia
eye
taste / olfactory
otic / lateral line
epidermis
periderm
fin
ionocytes / mucous
pigment cells
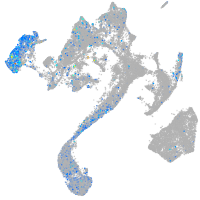
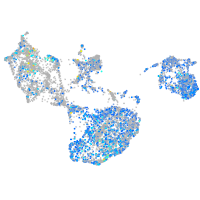
Expression by stage/cluster
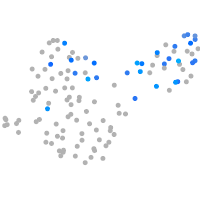
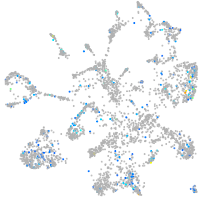
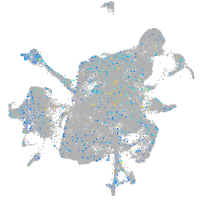
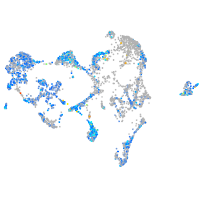
Correlated gene expression
Positive correlation
Negative correlation
Gene
r
Gene
r
tgm1l2
0.151
kctd12.2
-0.050
si:ch73-177h5.2
0.124
NC-002333.17
-0.049
LOC108192083
0.119
meis2a
-0.048
aqp10a
0.116
mki67
-0.046
dgat1a
0.114
zgc:165555.3
-0.044
XLOC-023979
0.114
pcdh18b
-0.043
si:ch73-359m17.11
0.111
zgc:114130
-0.043
si:dkey-237i9.8
0.105
mdka
-0.042
XLOC-038939
0.101
aqr
-0.041
si:dkey-175g6.2
0.100
CABZ01072614.1
-0.041
LOC103912066
0.100
srp68
-0.039
vgll2b
0.100
ccna2
-0.039
tsga10
0.100
LOC110438055
-0.039
ttll9
0.100
chl1b
-0.039
XLOC-023754
0.098
rrm2
-0.038
BX005105.1
0.098
rbbp4
-0.037
frmd5
0.098
ece1
-0.037
LOC100537538
0.097
ehmt1a
-0.037
XLOC-042319
0.096
arpc5a
-0.036
fgf10a
0.095
mapre1b
-0.035
si:ch73-359m17.5
0.095
arid1aa
-0.035
LOC110439967
0.094
waca
-0.035
pygb
0.093
kif20bb
-0.035
cpm
0.092
anln
-0.035
bmp7b
0.092
igf2bp1
-0.035
hcn4l
0.090
chtf8
-0.034
si:dkey-16i5.8
0.090
rps29
-0.034
fam110a
0.089
spc25
-0.034
tgfb3
0.089
pane1
-0.034
plk2a
0.089
zbtb17
-0.034
LOC101886572
0.088
armc1l
-0.034
hist2h2l
0.088
cenpf
-0.034
si:dkey-28d5.11
0.088
dgcr2
-0.034
arr3b
0.088
sat1a.1
-0.034
LOC110439529
0.087
tpx2
-0.034