Daniocell
spire1a (epidermis)
spire-type actin nucleation factor 1a
ZFIN
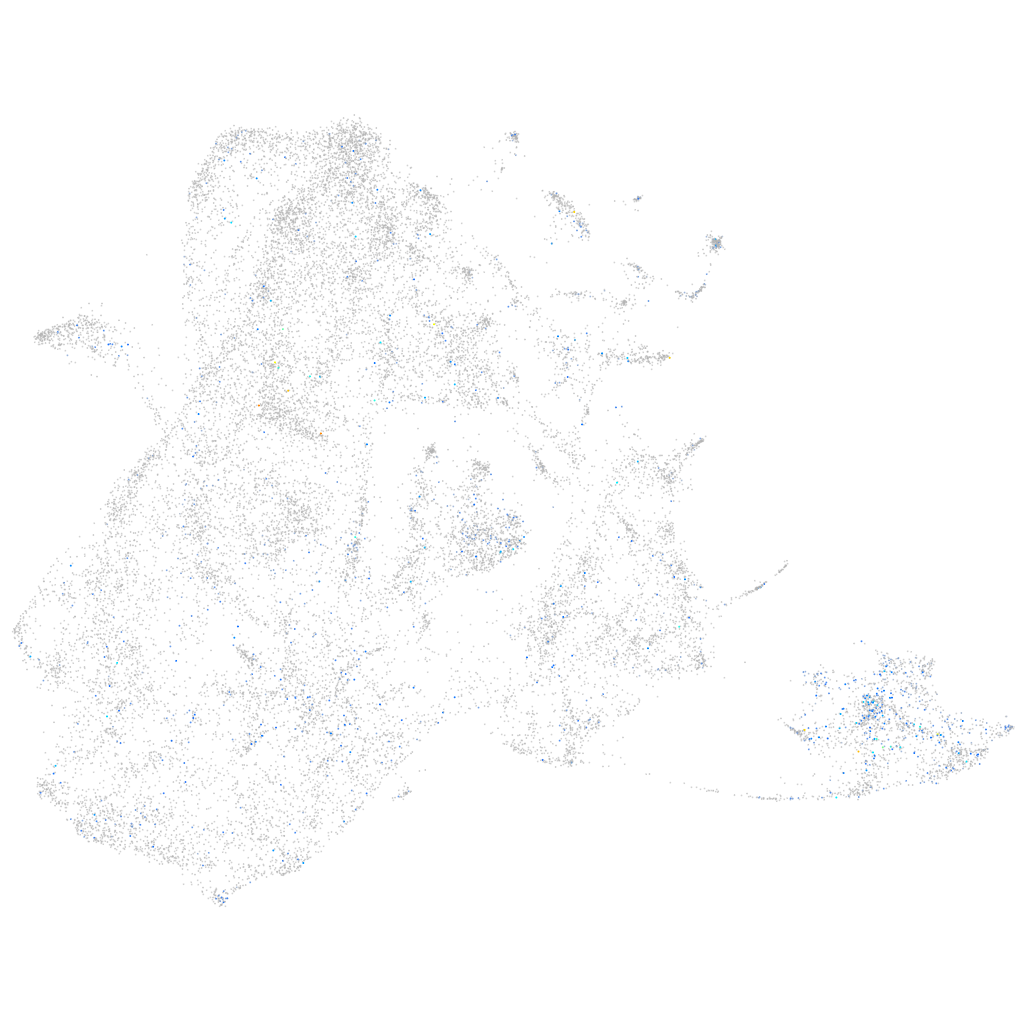
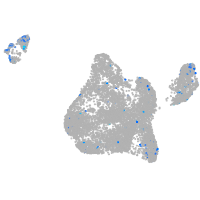
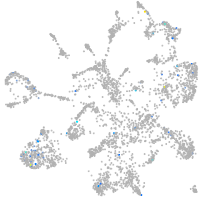
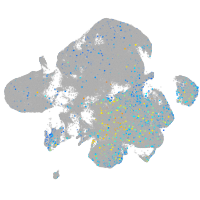
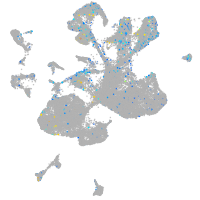
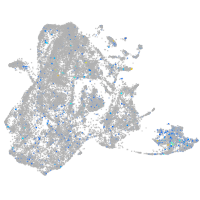
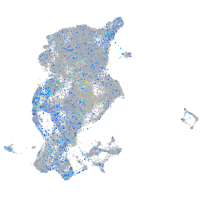
Gene expression UMAP
Display:
Expression
Stage
Other cell groups
all cells
blastomeres
PGCs
endoderm
axial mesoderm
muscle
mural cells /
non-skeletal muscle
mesenchyme
hematopoietic /
vasculature
pronephros
neural
spinal cord / glia
eye
taste / olfactory
otic / lateral line
epidermis
periderm
fin
ionocytes / mucous
pigment cells
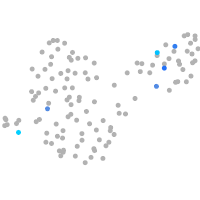
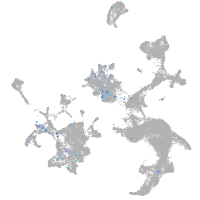
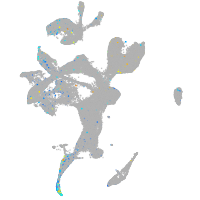
Expression by stage/cluster
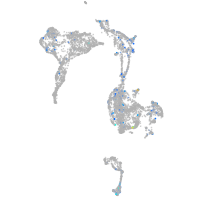
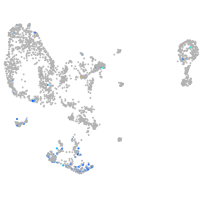
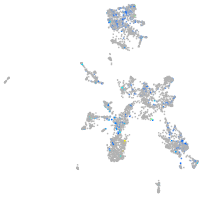
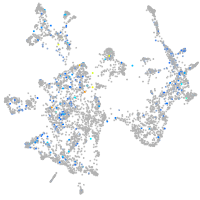
Correlated gene expression
Positive correlation
Negative correlation
Gene
r
Gene
r
evplb
0.168
tmsb4x
-0.111
si:ch211-157c3.4
0.163
pfn1
-0.082
scel
0.162
sparc
-0.082
evpla
0.160
col1a2
-0.076
krt1-19d
0.159
cldn1
-0.075
si:cabz01007794.1
0.158
cldni
-0.072
zgc:153665
0.156
ecrg4b
-0.071
si:ch73-204p21.2
0.156
col1a1b
-0.069
zgc:165423
0.152
si:dkey-16p21.8
-0.069
ppl
0.152
col11a1a
-0.067
ponzr5
0.151
actb2
-0.067
anxa1b
0.150
cotl1
-0.066
cldn23a
0.150
postnb
-0.065
agr1
0.150
actb1
-0.063
CABZ01039859.1
0.146
spaca4l
-0.063
stard14
0.143
col2a1b
-0.063
lye
0.143
zgc:86896
-0.062
anxa1c
0.140
pak2a
-0.062
dhrs13a.2
0.139
si:ch211-39i22.1
-0.062
zgc:100868
0.139
col1a1a
-0.061
si:ch211-195b11.3
0.139
krt5
-0.060
cldne
0.138
cyt1l
-0.058
ca2
0.138
hcls1
-0.056
stx11b.1
0.137
zgc:101810
-0.055
zgc:193505
0.136
rbp4
-0.055
nqo1
0.136
tagln2
-0.054
icn2
0.135
lgals1l1
-0.053
si:ch73-347e22.8
0.134
thy1
-0.053
gbgt1l4
0.134
rpl35
-0.053
capn9
0.133
csrp1a
-0.053
plekhf1
0.131
zgc:136930
-0.053
si:dkey-87o1.2
0.131
si:dkey-33c14.3
-0.051
si:dkey-222n6.2
0.130
tp63
-0.051
rab25a
0.130
pxna
-0.051
si:dkey-19b23.12
0.130
cfl1l
-0.051