Daniocell
spg11 (fin)
"SPG11 vesicle trafficking associated, spatacsin"
ZFIN
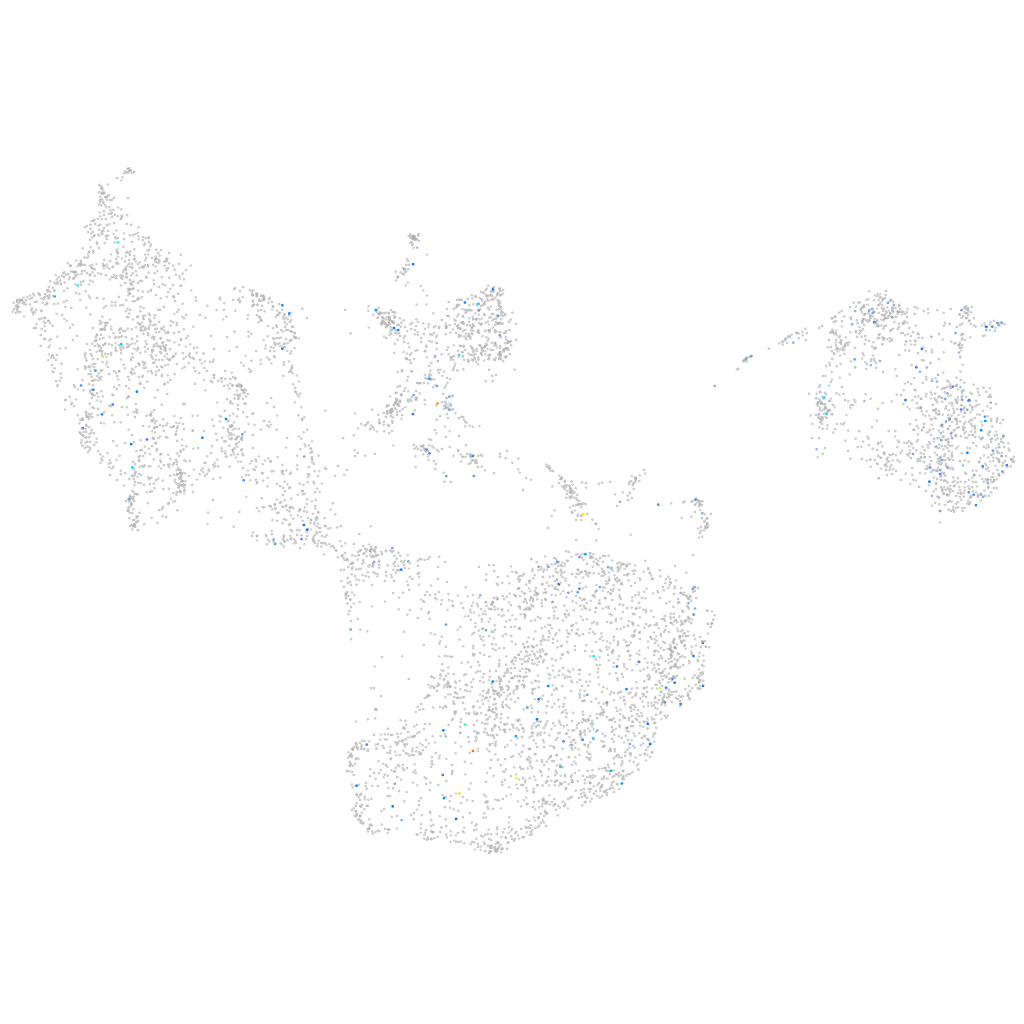
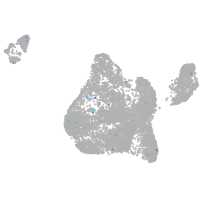
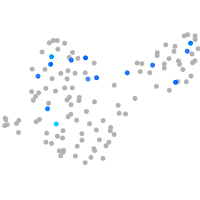
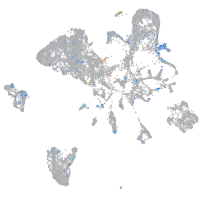
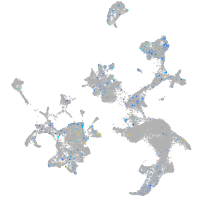
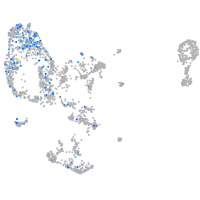
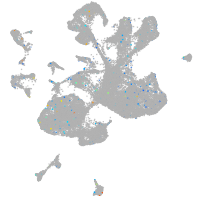
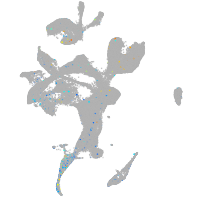
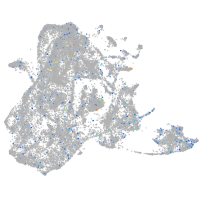
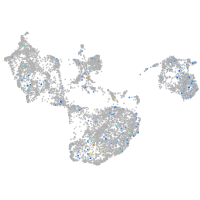
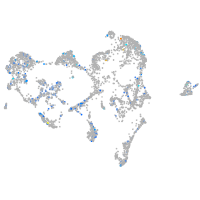
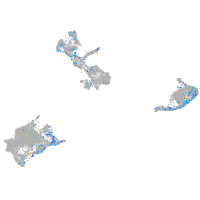
Gene expression UMAP
Display:
Expression
Stage
Other cell groups
all cells
blastomeres
PGCs
endoderm
axial mesoderm
muscle
mural cells /
non-skeletal muscle
mesenchyme
hematopoietic /
vasculature
pronephros
neural
spinal cord / glia
eye
taste / olfactory
otic / lateral line
epidermis
periderm
fin
ionocytes / mucous
pigment cells
Expression by stage/cluster
Correlated gene expression
Positive correlation
Negative correlation
Gene
r
Gene
r
LOC103911938
0.221
rps12
-0.049
sc:d189
0.176
rps15a
-0.045
LOC108182911
0.167
pvalb2
-0.040
XLOC-044140
0.153
fthl27
-0.039
XLOC-035162
0.139
actc1b
-0.038
XLOC-017492
0.139
si:ch211-222l21.1
-0.036
LOC110439832
0.138
hgd
-0.035
rxfp3.2b
0.135
hpdb
-0.034
plin6
0.134
rpl29
-0.034
XLOC-038945
0.129
cx43
-0.033
ADAM12 (1 of many)
0.123
calr3b
-0.033
si:ch211-126j24.1
0.121
pcbd1
-0.033
arhgef37
0.119
si:ch73-1a9.3
-0.033
LOC101883343
0.117
bhmt
-0.033
LOC108181171
0.116
sult1st1
-0.032
slc47a3
0.115
si:ch73-281n10.2
-0.032
rock2bl
0.113
tma7
-0.032
robo4
0.111
srsf11
-0.032
kcnn3
0.111
ntd5
-0.032
CABZ01055522.1
0.108
si:dkey-238c7.16
-0.031
nacad
0.105
c1qtnf5
-0.031
btr07
0.102
si:ch211-204c21.1
-0.031
si:dkey-26m3.3
0.101
rpl27
-0.031
spef2
0.100
crabp2a
-0.031
si:ch73-92i20.1
0.099
pdcd10b
-0.030
asic1c
0.099
rpl18a
-0.030
LOC103910314
0.098
qdpra
-0.030
atp1a1b
0.098
rps10
-0.030
ccdc92
0.096
prdx1
-0.030
tcn2
0.095
rpl19
-0.030
si:dkey-40g16.6
0.095
bmp2a
-0.030
sh2d3ca
0.095
rpl7a
-0.029
pcdh2g9
0.094
hist1h4l
-0.029
pla2g12b
0.094
rpl23
-0.029
LOC110438186
0.093
fkbp1aa
-0.029