Daniocell
socs9 (muscle)
suppressor of cytokine signaling 9
ZFIN
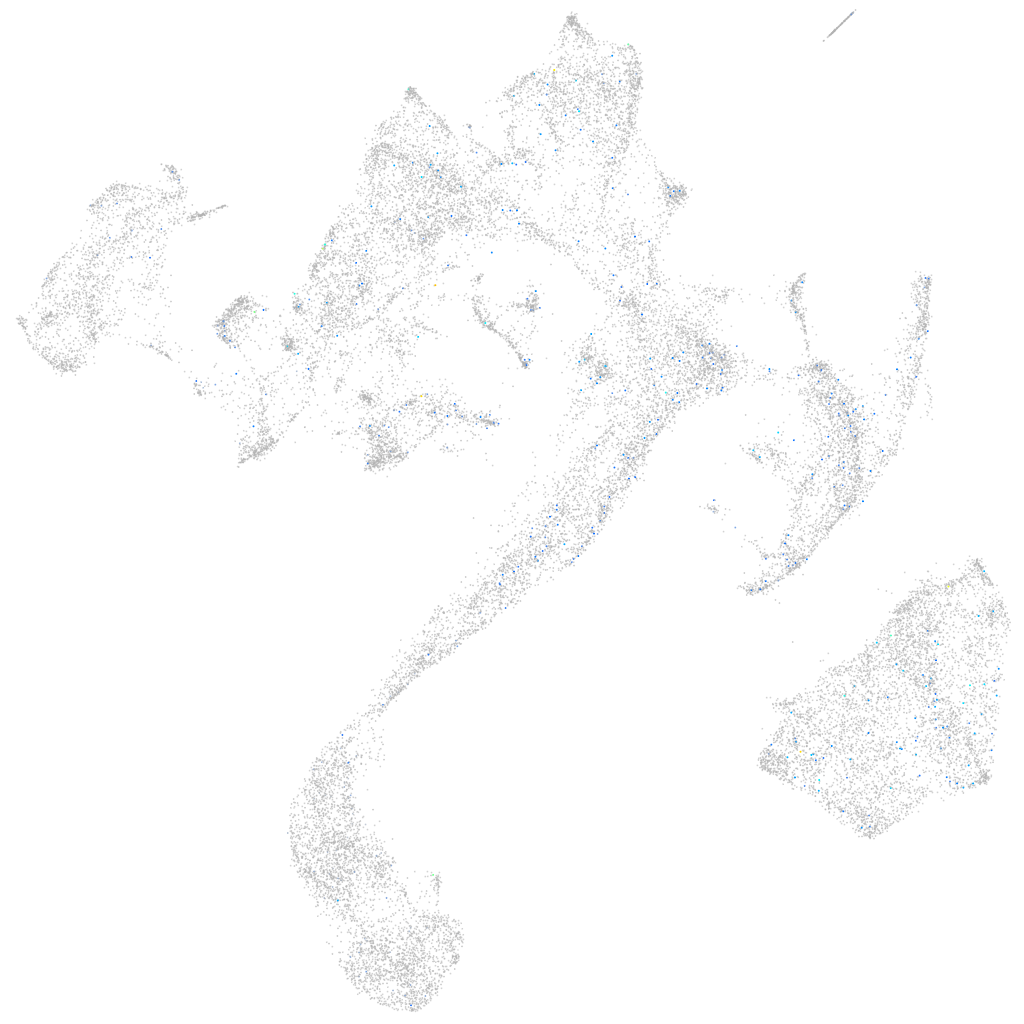
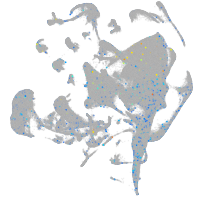
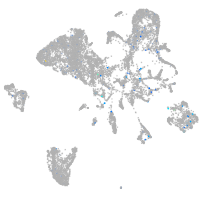
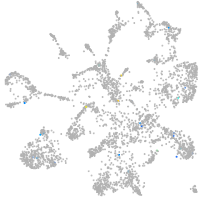
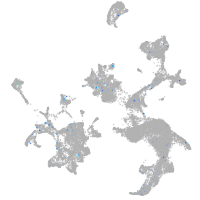
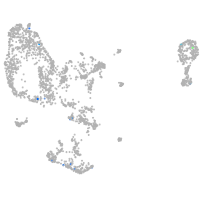
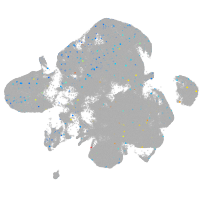
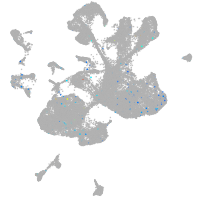
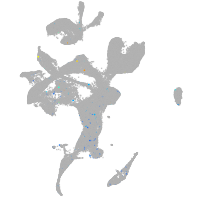
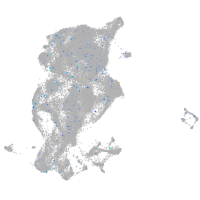
Gene expression UMAP
Display:
Expression
Stage
Other cell groups
all cells
blastomeres
PGCs
endoderm
axial mesoderm
muscle
mural cells /
non-skeletal muscle
mesenchyme
hematopoietic /
vasculature
pronephros
neural
spinal cord / glia
eye
taste / olfactory
otic / lateral line
epidermis
periderm
fin
ionocytes / mucous
pigment cells
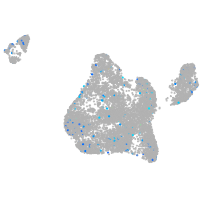
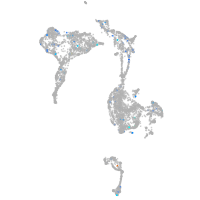
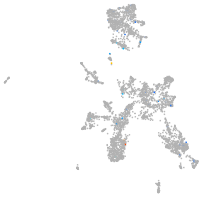
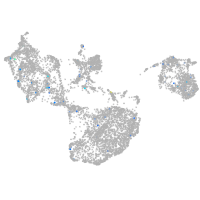
Expression by stage/cluster
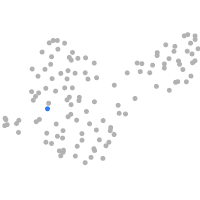
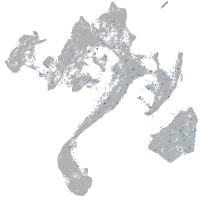
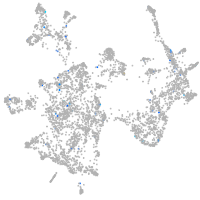
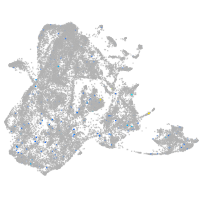
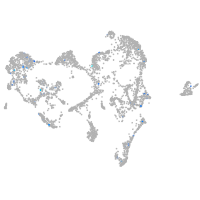
Correlated gene expression
Positive correlation
Negative correlation
Gene
r
Gene
r
si:ch211-250k18.5
0.089
ak1
-0.042
BX663520.1
0.086
ckmb
-0.042
f13a1a.1
0.077
ldb3b
-0.041
XLOC-001155
0.072
ckma
-0.041
XLOC-000490
0.070
atp2a1
-0.040
CU571319.2
0.069
tnnc2
-0.040
si:dkey-28d5.12
0.066
actc1b
-0.040
LOC108190781
0.063
neb
-0.039
BX927317.3
0.060
aldoab
-0.039
prss60.1
0.058
si:ch73-367p23.2
-0.039
CR790365.1
0.058
nme2b.2
-0.037
si:dkey-183c2.4
0.056
tnnt3a
-0.037
LOC556451
0.054
si:dkey-16p21.8
-0.037
cx28.9
0.054
gapdh
-0.036
LOC101886672
0.052
glud1b
-0.036
adcy3b
0.052
pgam2
-0.036
ctbs
0.051
mylpfa
-0.036
AL953896.1
0.051
casq2
-0.036
p2ry13
0.051
eno3
-0.036
LOC108184005
0.050
ank1a
-0.035
pjvk
0.050
prx
-0.035
taar20j
0.050
mylz3
-0.035
XLOC-042037
0.050
pkmb
-0.035
LOC101883850
0.050
myom1a
-0.035
LOC108182213
0.049
acta1b
-0.035
ak7a
0.049
hrc
-0.035
LOC103909344
0.048
ttn.2
-0.035
CR392036.1
0.047
actn3a
-0.035
si:ch211-153b23.3
0.047
si:ch211-266g18.10
-0.034
FQ311907.1
0.047
tmem38a
-0.034
CABZ01009512.2
0.046
si:ch211-255p10.3
-0.034
khdrbs1a
0.046
XLOC-001975
-0.034
hmga1a
0.046
tpma
-0.034
cirbpb
0.046
cav3
-0.034
nucks1a
0.046
actn3b
-0.034