Daniocell
snf8 (fin)
SNF8 subunit of ESCRT-II
ZFIN
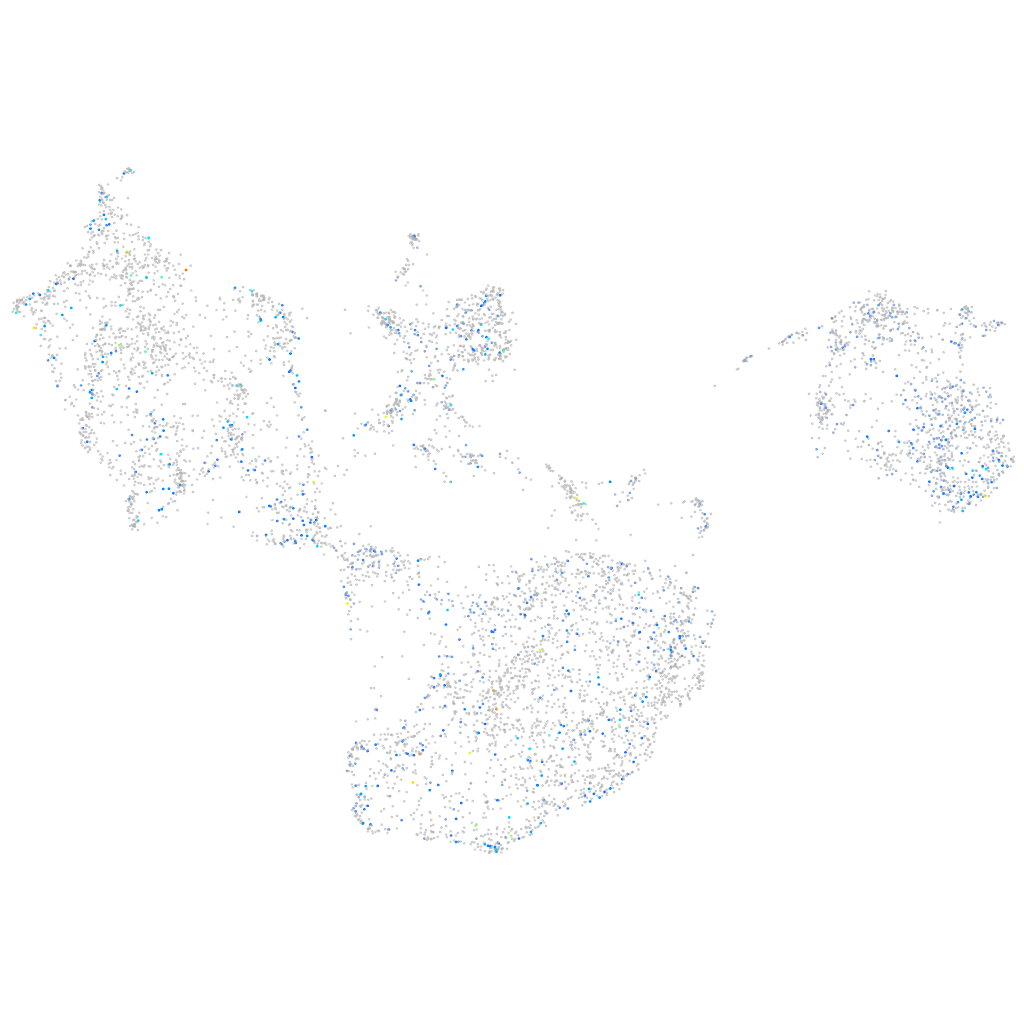
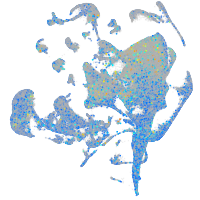
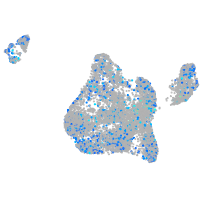
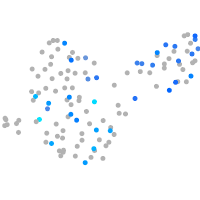
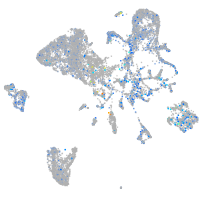
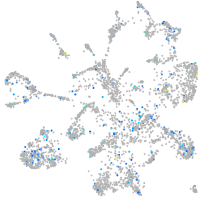
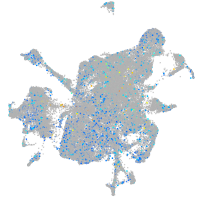
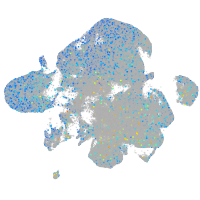
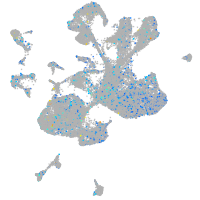
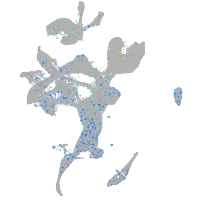
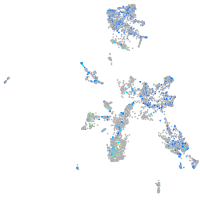
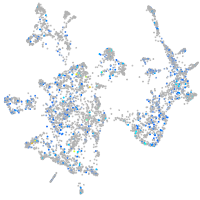
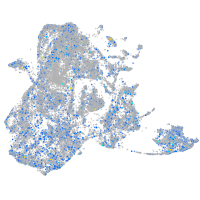
Gene expression UMAP
Display:
Expression
Stage
Other cell groups
all cells
blastomeres
PGCs
endoderm
axial mesoderm
muscle
mural cells /
non-skeletal muscle
mesenchyme
hematopoietic /
vasculature
pronephros
neural
spinal cord / glia
eye
taste / olfactory
otic / lateral line
epidermis
periderm
fin
ionocytes / mucous
pigment cells
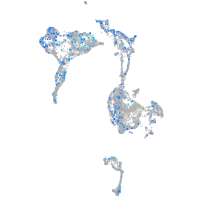
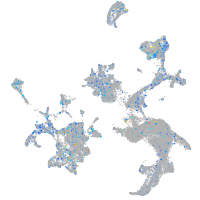
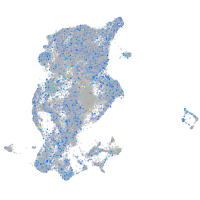
Expression by stage/cluster
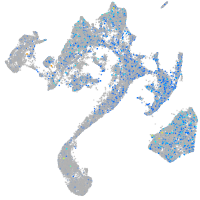
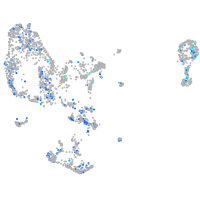
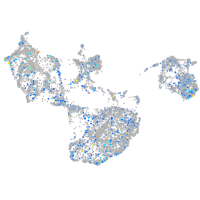
Correlated gene expression
Positive correlation
Negative correlation
Gene
r
Gene
r
LOC103909642
0.109
rpl36
-0.064
pimr177
0.109
rpl29
-0.050
or123-1
0.108
rplp2l
-0.045
CABZ01086574.1
0.107
rps2
-0.042
v2ra18
0.104
si:dkey-151g10.6
-0.041
si:ch211-113d11.5
0.098
rpl18
-0.040
si:ch211-167j6.3
0.095
pabpc1a
-0.040
BX323074.2
0.094
rpl37
-0.039
snx20
0.094
bhmt
-0.038
CR762407.1
0.092
rpl39
-0.037
CABZ01078244.2
0.092
rplp1
-0.037
CR376751.1
0.091
and4
-0.037
si:ch73-383g2.1
0.090
nipsnap3a
-0.037
LOC110438343
0.089
qdpra
-0.036
myh7bb
0.089
rpl32
-0.036
slc47a2.2
0.089
rpl14
-0.036
LOC108179947
0.088
ttc36
-0.036
CR352209.1
0.086
ecrg4a
-0.034
LOC101886528
0.085
hgd
-0.033
klhl24a
0.085
rps20
-0.033
prss12
0.083
pcbd1
-0.033
arhgef33
0.082
rps21
-0.031
BX901974.1
0.082
rps5
-0.031
XLOC-042485
0.081
hpdb
-0.031
si:dkey-44g17.6
0.081
psmd2
-0.030
znf1055
0.080
cd248b
-0.029
si:ch211-67f24.7
0.079
endouc
-0.029
traf5
0.079
myom2a
-0.029
LOC110438274
0.077
enpp2
-0.028
sez6a
0.076
CABZ01092746.1
-0.028
tubb4b
0.076
rps19
-0.028
arid6
0.075
rps29
-0.028
zgc:194242
0.075
rps12
-0.028
kmt2a
0.075
gstz1
-0.028
gmfb
0.074
zgc:114181
-0.027