Daniocell
smyd3 (pronephros)
SET and MYND domain containing 3
ZFIN
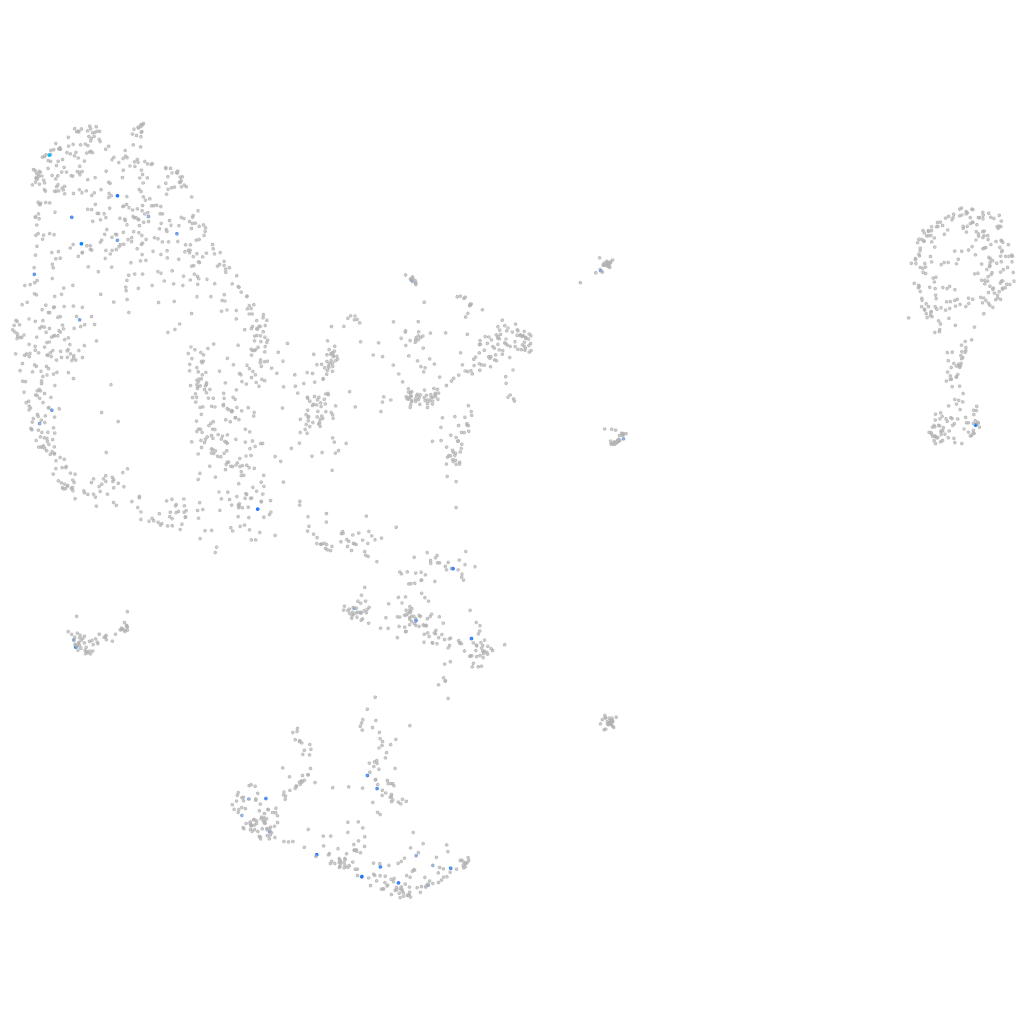
Gene expression UMAP
Display:
Expression
Stage
Other cell groups
all cells
blastomeres
PGCs
endoderm
axial mesoderm
muscle
mural cells /
non-skeletal muscle
mesenchyme
hematopoietic /
vasculature
pronephros
neural
spinal cord / glia
eye
taste / olfactory
otic / lateral line
epidermis
periderm
fin
ionocytes / mucous
pigment cells
Expression by stage/cluster
Correlated gene expression
Positive correlation
Negative correlation
Gene
r
Gene
r
CABZ01038493.1
0.409
ptmab
-0.064
AL928920.3
0.274
si:ch73-1a9.3
-0.057
CR589882.1
0.274
marcksl1b
-0.054
htr6
0.209
taf15
-0.051
il17c
0.204
top1l
-0.051
zgc:174259
0.200
glula
-0.048
znf1085
0.196
setb
-0.045
CT990561.2
0.193
aqp8b
-0.044
si:dkey-96f10.1
0.187
gss
-0.043
fam160a1b
0.185
cirbpb
-0.043
CT583650.1
0.184
myh10
-0.043
cxcr3.1
0.184
cdh2
-0.043
XLOC-004189
0.181
lmnb2
-0.043
ggact.3
0.181
ca9
-0.042
CABZ01084942.1
0.181
snrpe
-0.042
snx1b
0.180
lsm6
-0.041
BX005073.3
0.180
ap2m1b
-0.041
BX323822.1
0.180
usp36
-0.041
faslg
0.180
mbd3b
-0.041
si:dkey-183i3.6
0.180
h3f3d
-0.041
si:dkey-50i6.5
0.180
snrnp70
-0.040
LOC103908927
0.180
add1
-0.040
si:dkey-46i9.6
0.178
hmgn6
-0.040
LOC103911994
0.171
cfl1
-0.040
nog5
0.171
atp1b3b
-0.040
si:ch211-243a20.4
0.171
ddx21
-0.039
LOC103910876
0.171
fxyd6l
-0.039
XLOC-008474
0.171
tmem106a
-0.039
atp13a2
0.169
si:ch211-222l21.1
-0.039
bcl3
0.164
si:ch211-137a8.4
-0.039
FP236542.1
0.161
hmha1a
-0.039
slc16a5b
0.161
cx43.4
-0.038
RASSF5
0.159
zmp:0000000545
-0.038
NC-002333.19
0.157
ssr2
-0.038
znf408
0.157
pdap1a
-0.038