small integral membrane protein 4
ZFIN 
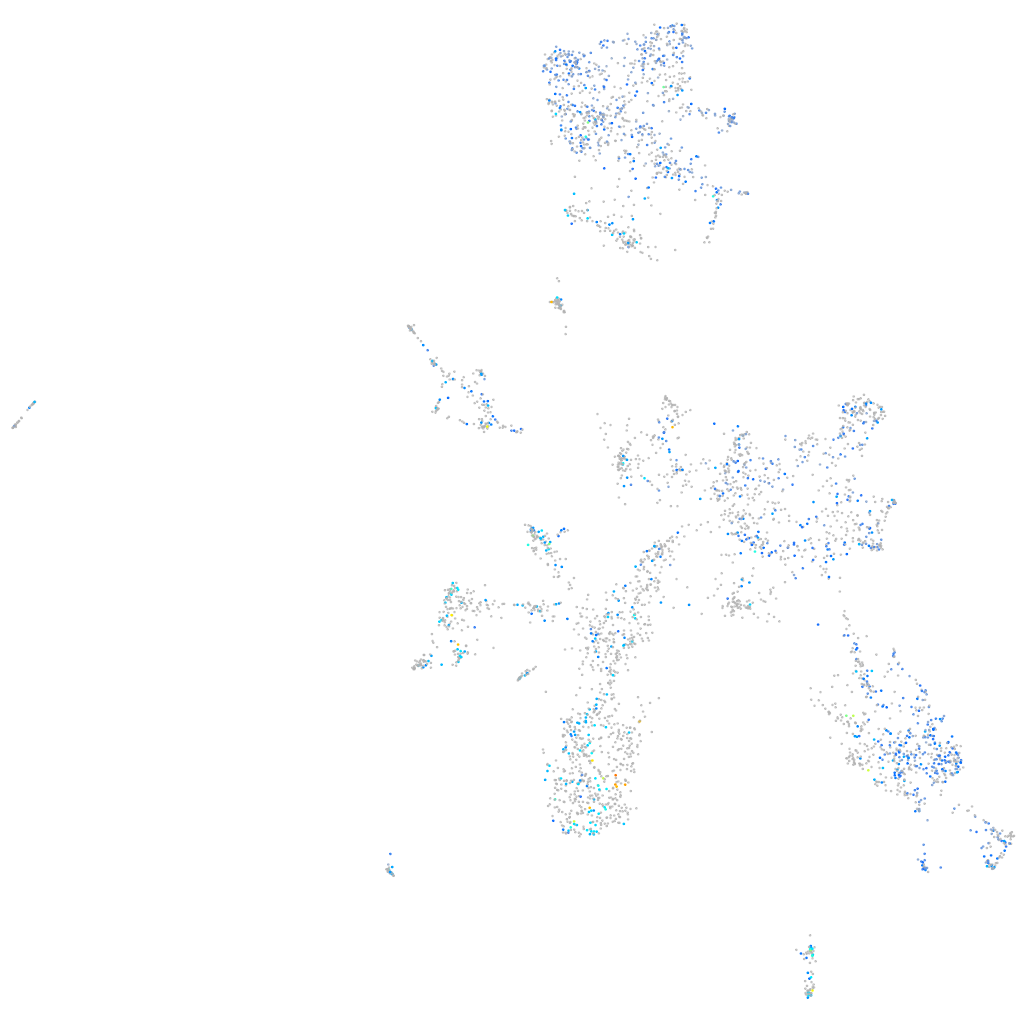
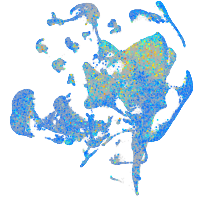
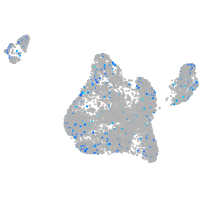
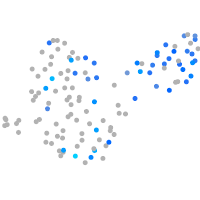
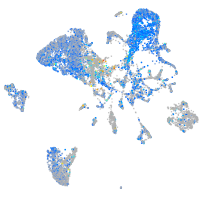
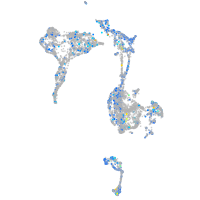
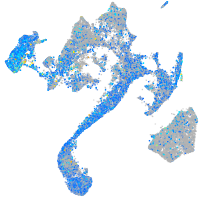
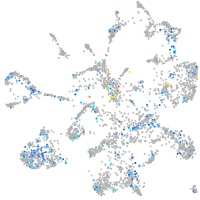
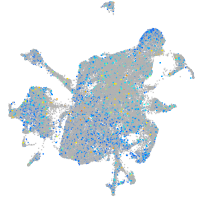
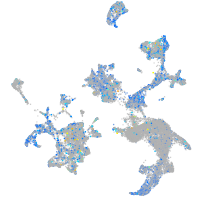
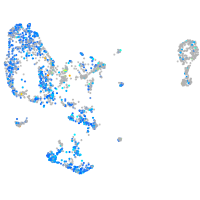
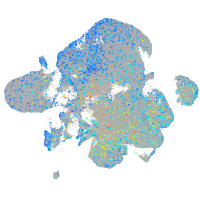
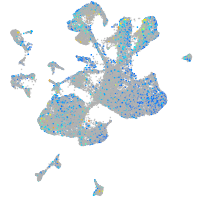
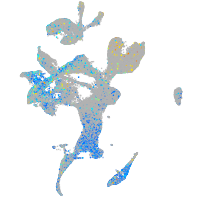
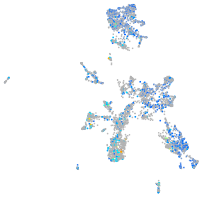
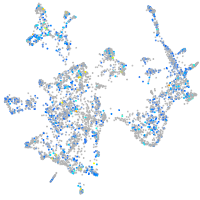
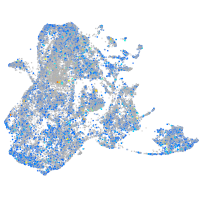
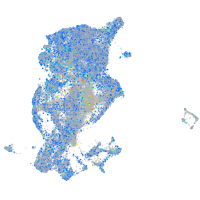
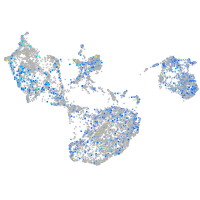
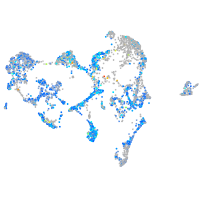
Expression by stage/cluster


Correlated gene expression


| Positive correlation | Negative correlation | ||
| Gene | r | Gene | r |
| cox8a | 0.136 | sox11a | -0.067 |
| atp5mc1 | 0.126 | rpl15 | -0.064 |
| tpi1b | 0.122 | rps19 | -0.064 |
| chchd10 | 0.121 | rps9 | -0.063 |
| saga | 0.120 | rpl14 | -0.062 |
| fthl28 | 0.118 | rpsa | -0.060 |
| gapdhs | 0.118 | sox11b | -0.059 |
| pimr197.1 | 0.117 | rps21 | -0.059 |
| fthl31 | 0.116 | rps4x | -0.059 |
| atp5fa1 | 0.115 | rps16 | -0.058 |
| cox7a2a | 0.113 | rpl31 | -0.058 |
| atp5pd | 0.112 | rps29 | -0.058 |
| crema | 0.112 | hnrnpa1a | -0.058 |
| COX5B | 0.111 | rps26 | -0.057 |
| ndufb4 | 0.110 | hmga1a | -0.057 |
| ldhba | 0.110 | neurod4 | -0.056 |
| ndufv3 | 0.110 | ebf2 | -0.056 |
| si:ch211-237l4.6 | 0.109 | si:dkey-56m19.5 | -0.055 |
| atp5if1b | 0.109 | si:ch211-222l21.1 | -0.055 |
| soul2 | 0.108 | si:dkey-151g10.6 | -0.055 |
| gpia | 0.108 | rps15 | -0.054 |
| atp5l | 0.104 | uba52 | -0.053 |
| ppifb | 0.104 | rps10 | -0.053 |
| tpi1a | 0.104 | rps3 | -0.053 |
| atp1b1b | 0.103 | rpl18a | -0.052 |
| LOC103909376 | 0.103 | rps25 | -0.052 |
| ca2 | 0.103 | rpl32 | -0.052 |
| vdac2 | 0.103 | rpl38 | -0.052 |
| arpc3 | 0.103 | faua | -0.052 |
| fthl27 | 0.103 | smarcd1 | -0.051 |
| atp5mc3b | 0.102 | sox4a | -0.051 |
| scn1ba | 0.102 | brsk2b | -0.050 |
| mt2 | 0.102 | si:ch211-193l2.6 | -0.050 |
| uqcrfs1 | 0.102 | rps27.1 | -0.050 |
| TSTD1 | 0.101 | rpl30 | -0.049 |


