Daniocell
slf2 (pronephros)
SMC5-SMC6 complex localization factor 2
ZFIN
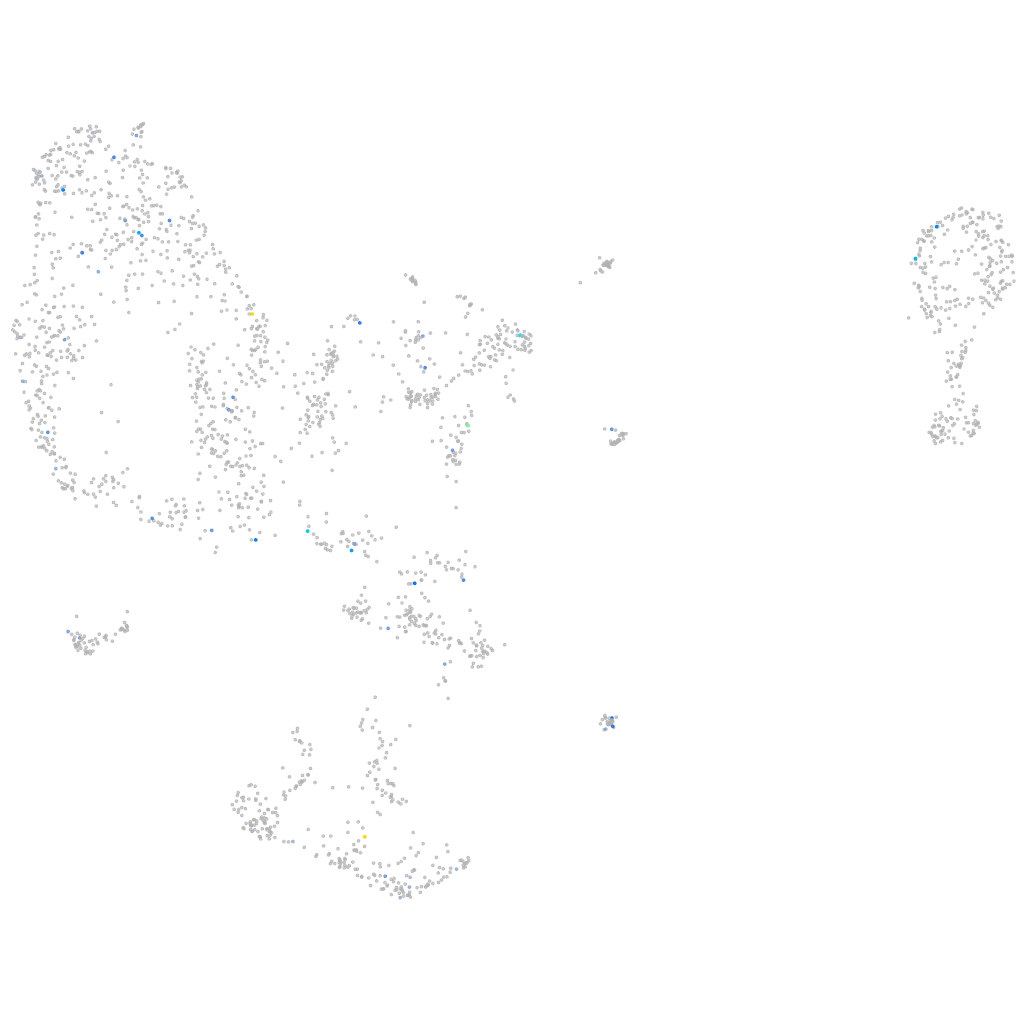
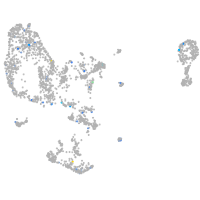
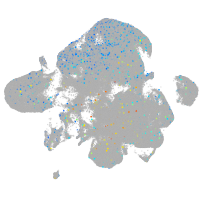
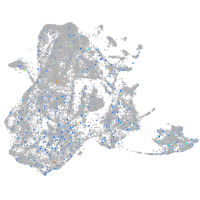
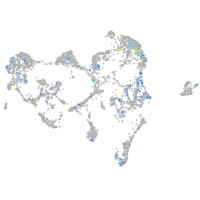
Gene expression UMAP
Display:
Expression
Stage
Other cell groups
all cells
blastomeres
PGCs
endoderm
axial mesoderm
muscle
mural cells /
non-skeletal muscle
mesenchyme
hematopoietic /
vasculature
pronephros
neural
spinal cord / glia
eye
taste / olfactory
otic / lateral line
epidermis
periderm
fin
ionocytes / mucous
pigment cells
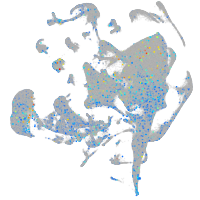
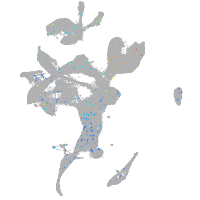
Expression by stage/cluster
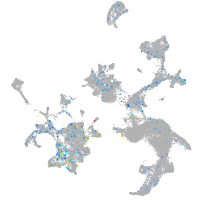
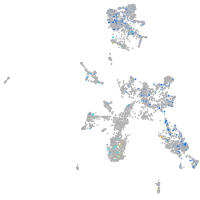
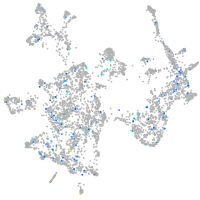
Correlated gene expression
Positive correlation
Negative correlation
Gene
r
Gene
r
fam19a4b
0.371
rps24
-0.079
BX005153.2
0.368
mrpl36
-0.068
sc:d189
0.351
psmb1
-0.058
CR848784.4
0.340
atp5md
-0.056
si:ch211-146l10.7
0.328
atp5po
-0.055
LOC110437781
0.327
eif2s2
-0.055
si:ch73-190m4.1
0.325
uqcr10
-0.054
mttp
0.321
ndufab1b
-0.053
sox2ot
0.318
rps18
-0.051
lingo2a
0.314
psmc5
-0.051
ftr14l
0.310
snrpb
-0.049
LOC110438216
0.302
snrpg
-0.049
si:ch73-151m17.5
0.302
chmp6b
-0.048
XLOC-028935
0.298
ndufa1
-0.048
snai3
0.290
rwdd1
-0.047
LOC108182764
0.287
rpl4
-0.046
ttll5
0.285
rps3
-0.046
SLC29A4 (1 of many)
0.284
zc3h15
-0.046
LO017700.2
0.282
cox8a
-0.046
LOC110437922
0.282
acin1a
-0.045
LOC797394
0.282
si:ch211-133n4.4
-0.045
ubtd1a
0.269
rpl34
-0.044
npy
0.259
smim4
-0.044
CABZ01088484.1
0.254
mrps23
-0.044
BX936415.1
0.250
ncl
-0.044
BX950187.1
0.244
DHDH
-0.044
BX004785.2
0.243
pgpep1
-0.044
hepacama
0.243
ndufa6
-0.043
lgals8b
0.242
lmtk2
-0.043
BX005368.1
0.240
mrpl39
-0.043
fam19a5a
0.238
anapc11
-0.043
FP017151.1
0.237
ap2m1a
-0.043
LOC101883308
0.233
glrx
-0.043
zmp:0000001073
0.232
mrps7
-0.043
cacna1ea
0.232
psma5
-0.042