Daniocell
slc6a15 (ionocytes / mucous-producing)
solute carrier family 6 member 15
ZFIN
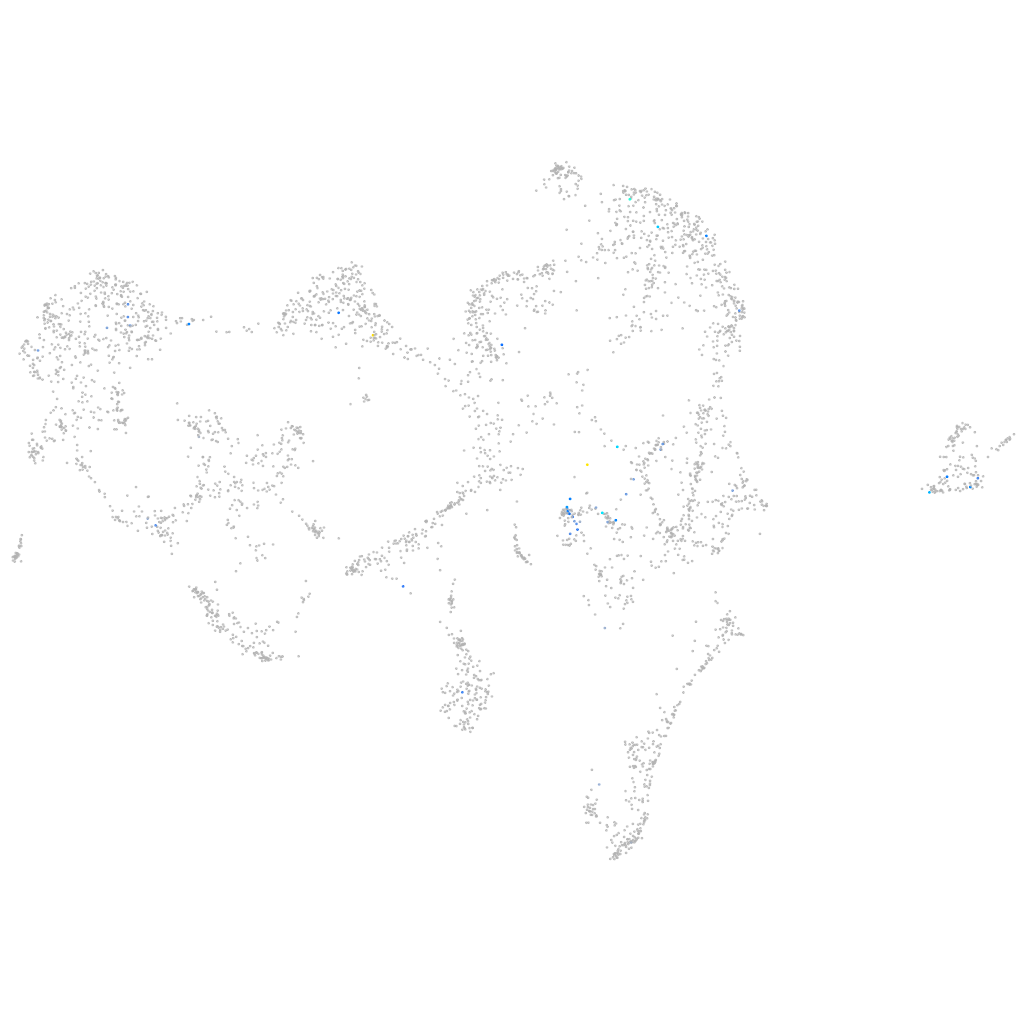
Gene expression UMAP
Display:
Expression
Stage
Other cell groups
all cells
blastomeres
PGCs
endoderm
axial mesoderm
muscle
mural cells /
non-skeletal muscle
mesenchyme
hematopoietic /
vasculature
pronephros
neural
spinal cord / glia
eye
taste / olfactory
otic / lateral line
epidermis
periderm
fin
ionocytes / mucous
pigment cells
Expression by stage/cluster
Correlated gene expression
Positive correlation
Negative correlation
Gene
r
Gene
r
tppp2
0.329
rps27a
-0.081
rcvrna
0.329
rps2
-0.066
LOC110438674
0.301
cd9b
-0.065
ccdc103
0.297
cldnb
-0.065
eef1a1b
0.294
tuba8l2
-0.064
si:ch73-106g13.1
0.294
ier2a
-0.062
itih3a
0.294
selenow1
-0.061
XLOC-016403
0.286
dnase1l4.1
-0.060
ccser2a
0.268
rps23
-0.059
si:ch211-127d4.3
0.265
myl12.1
-0.059
si:ch73-199e17.1
0.262
wu:fb18f06
-0.059
nell2a
0.259
rps12
-0.057
XLOC-039765
0.247
ndufs7
-0.056
XLOC-038745
0.229
chmp1b
-0.056
XLOC-013326
0.225
epcam
-0.055
si:dkey-28e7.3
0.224
zgc:56493
-0.054
BX663525.2
0.223
krt4
-0.054
myh11b
0.219
eef1da
-0.054
barhl1b
0.218
chmp2bb
-0.053
IYD
0.217
sec61g
-0.053
tmx2a
0.217
spint2
-0.053
syn1
0.217
cldnh
-0.053
crb2a
0.217
tpt1
-0.053
ncanb
0.217
s100u
-0.052
si:ch73-215f7.1
0.212
si:ch211-195b11.3
-0.052
gpm6aa
0.212
fuca1.1
-0.052
LOC101883391
0.212
tmsb1
-0.052
si:ch73-382f3.1
0.210
arhgdia
-0.050
sema5ba
0.210
pls3
-0.050
tmem151a
0.208
ap1s3b
-0.050
BX908782.2
0.208
rps24
-0.050
XLOC-024261
0.202
ckap4
-0.050
npy2rl
0.201
fthl27
-0.050
si:ch211-142b24.8
0.200
rab5c
-0.049
prdm12a
0.200
eif3g
-0.048