Daniocell
slc35a3a (taste / olfactory)
solute carrier family 35 member A3a
ZFIN
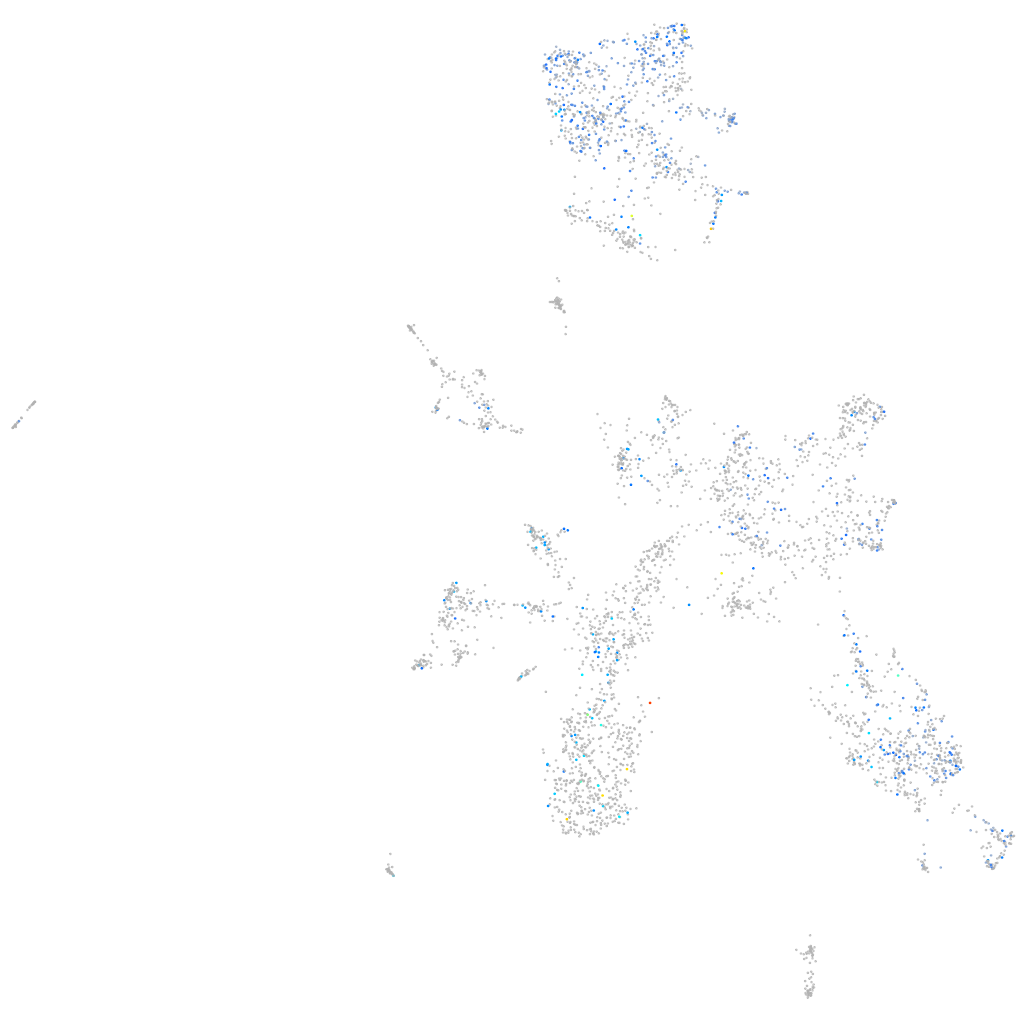
Gene expression UMAP
Display:
Expression
Stage
Other cell groups
all cells
blastomeres
PGCs
endoderm
axial mesoderm
muscle
mural cells /
non-skeletal muscle
mesenchyme
hematopoietic /
vasculature
pronephros
neural
spinal cord / glia
eye
taste / olfactory
otic / lateral line
epidermis
periderm
fin
ionocytes / mucous
pigment cells
Expression by stage/cluster
Correlated gene expression
Positive correlation
Negative correlation
Gene
r
Gene
r
CU207257.1
0.211
elavl3
-0.101
LOC100536119
0.206
si:ch211-222l21.1
-0.095
zmat4a
0.194
sox11b
-0.085
brinp3b
0.193
insm1a
-0.083
si:ch73-347e22.8
0.185
tmeff1b
-0.077
LOC100149223
0.179
CU467822.1
-0.075
ponzr5
0.173
neurod1
-0.074
zgc:165423
0.173
si:ch211-194k22.8
-0.072
klf3
0.172
NC-002333.4
-0.071
baiap2l2b
0.166
sox11a
-0.070
XLOC-043020
0.166
si:dkey-56m19.5
-0.068
zgc:153665
0.164
hnrnpa0a
-0.068
si:dkey-19b23.12
0.163
ebf2
-0.068
si:ch211-195b11.3
0.161
stmn1b
-0.066
si:cabz01007794.1
0.161
tmsb
-0.065
si:dkey-87o1.2
0.160
tuba1a
-0.065
zgc:153284
0.158
ebf3a
-0.064
si:ch211-157c3.4
0.158
neurod4
-0.063
foxq1a
0.156
insm1b
-0.063
si:ch73-199e17.1
0.156
fezf1
-0.060
s100v2
0.156
evlb
-0.060
hrc
0.154
nkain1
-0.059
si:ch211-237i5.4
0.153
rtn1a
-0.059
si:ch211-217k17.9
0.153
ptmab
-0.059
kcnj12a
0.153
her15.1
-0.058
evpla
0.151
h3f3d
-0.058
gadd45ab
0.151
lhx2a
-0.056
ppl
0.151
srrm4
-0.056
agr1
0.150
her4.2
-0.056
s100v1
0.149
tnn
-0.055
col17a1b
0.149
LOC100537342
-0.055
evplb
0.149
cxcr4b
-0.055
cpt1b
0.149
uncx
-0.055
tent5bb
0.148
her4.1
-0.054
si:dkey-248g15.3
0.148
NC-002333.17
-0.054