Daniocell
slc25a19 (glial cells / spinal cord)
solute carrier family 25 member 19
ZFIN
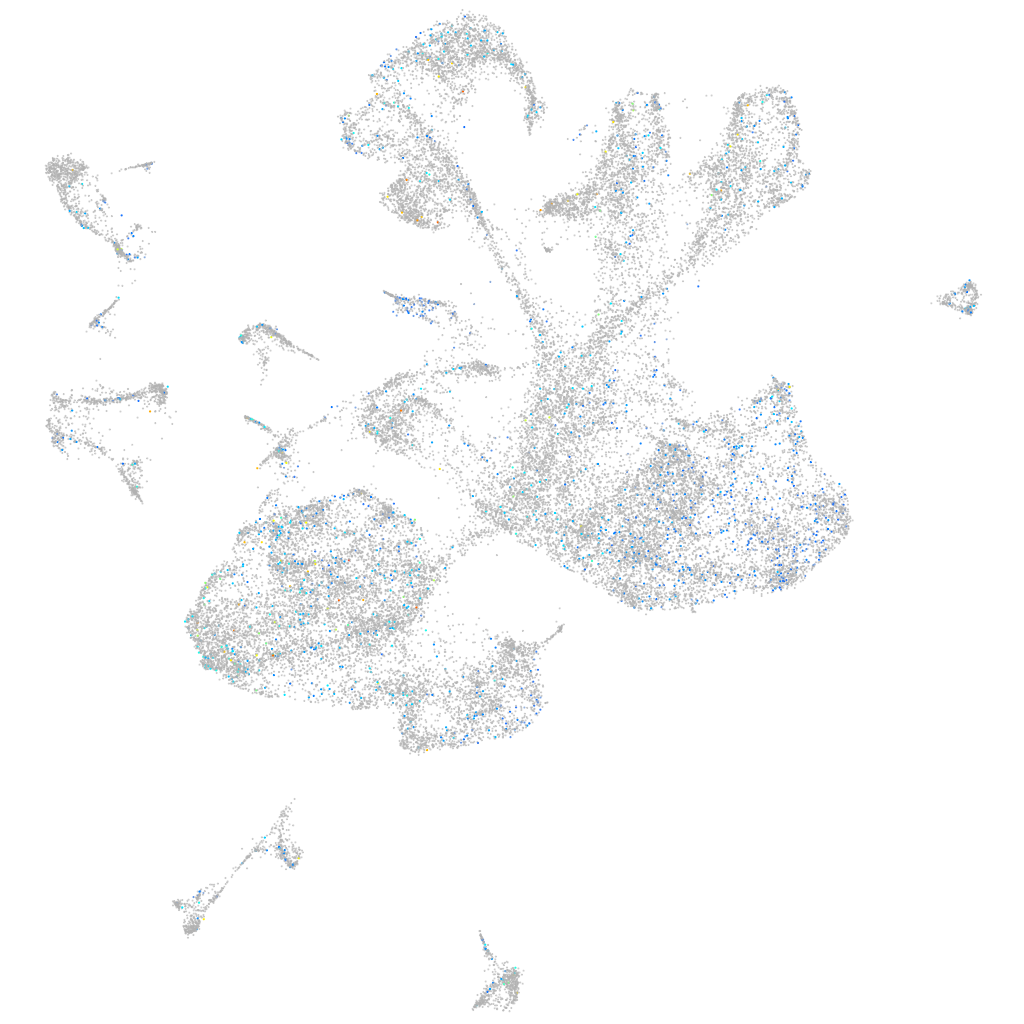
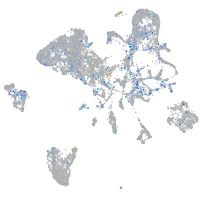
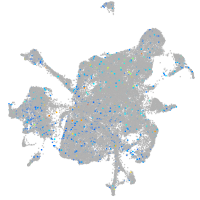
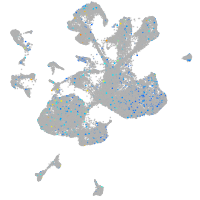
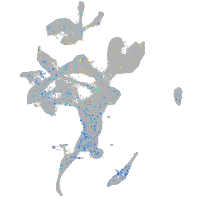
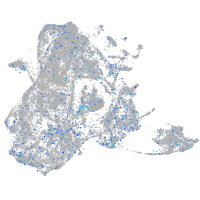
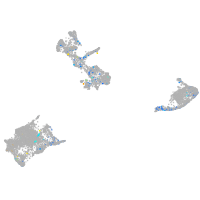
Gene expression UMAP
Display:
Expression
Stage
Other cell groups
all cells
blastomeres
PGCs
endoderm
axial mesoderm
muscle
mural cells /
non-skeletal muscle
mesenchyme
hematopoietic /
vasculature
pronephros
neural
spinal cord / glia
eye
taste / olfactory
otic / lateral line
epidermis
periderm
fin
ionocytes / mucous
pigment cells
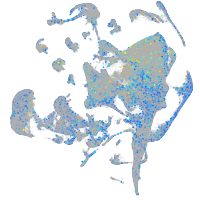
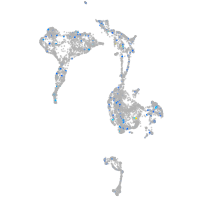
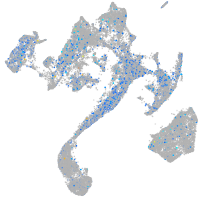
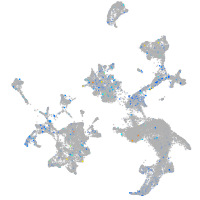
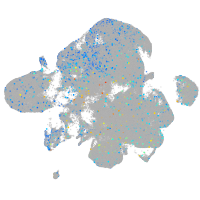
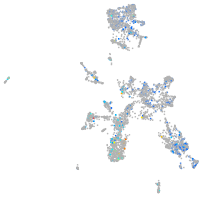
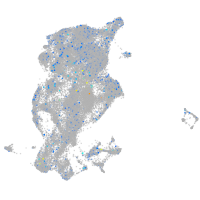
Expression by stage/cluster
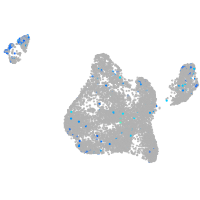
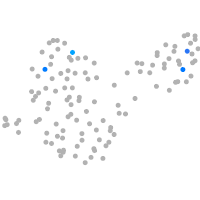
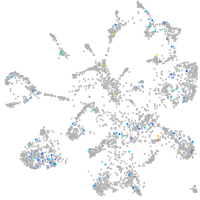
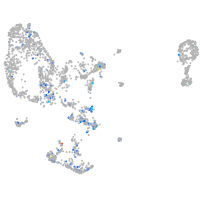
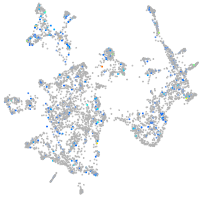
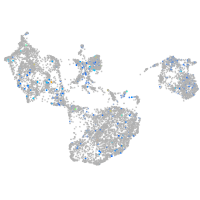
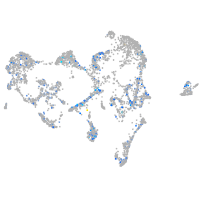
Correlated gene expression
Positive correlation
Negative correlation
Gene
r
Gene
r
hbaa1
0.061
sox11b
-0.032
LOC100536607
0.059
elavl3
-0.031
LOC100535016
0.051
si:ch211-57n23.4
-0.030
LOC108191976
0.041
tp53inp2
-0.028
prob1
0.040
myt1b
-0.028
LOC108179692
0.040
kdm6ba
-0.026
BX649620.1
0.040
ebf2
-0.026
uqcrh
0.039
si:ch73-386h18.1
-0.026
atp5mc3a
0.039
mpp2a
-0.026
BX248331.2
0.039
cdkn1ca
-0.024
XLOC-029465
0.038
dlb
-0.023
atp5mc3b
0.038
gdf11
-0.023
ldhba
0.038
lrrn1
-0.023
LOC103910886
0.038
hapln1a
-0.022
mrpl12
0.038
LOC798783
-0.022
si:ch73-138i16.1
0.037
nhlh2
-0.022
mtnr1c
0.037
gadd45gb.1
-0.022
LOC110439395
0.037
LOC100537384
-0.022
c1qbp
0.037
fstl1a
-0.021
fbl
0.037
scrt1a
-0.021
ntng2b
0.037
CR848812.1
-0.021
adi1
0.036
si:ch73-21g5.7
-0.020
timm8b
0.036
pou3f1
-0.020
cnbpa
0.036
ubap2a
-0.020
npm1a
0.036
hoxb8a
-0.020
atp5mc1
0.035
pmepa1
-0.020
her6
0.035
NC-002333.17
-0.020
rpl7l1
0.035
epb41a
-0.019
slc39a4
0.035
zfhx3
-0.019
sigmar1
0.035
hoxd3a
-0.019
grm3
0.035
si:ch211-222l21.1
-0.019
RF01225
0.035
CU633775.1
-0.019
LOC101886864
0.035
pik3r3b
-0.019
pa2g4a
0.034
scrt2
-0.019
diabloa
0.034
hoxa9a
-0.018