Daniocell
si:dkeyp-80c12.7 (mesenchyme)
si:dkeyp-80c12.7 [Source:ZFIN;Acc:ZDB-GENE-090312-2]
ZFIN
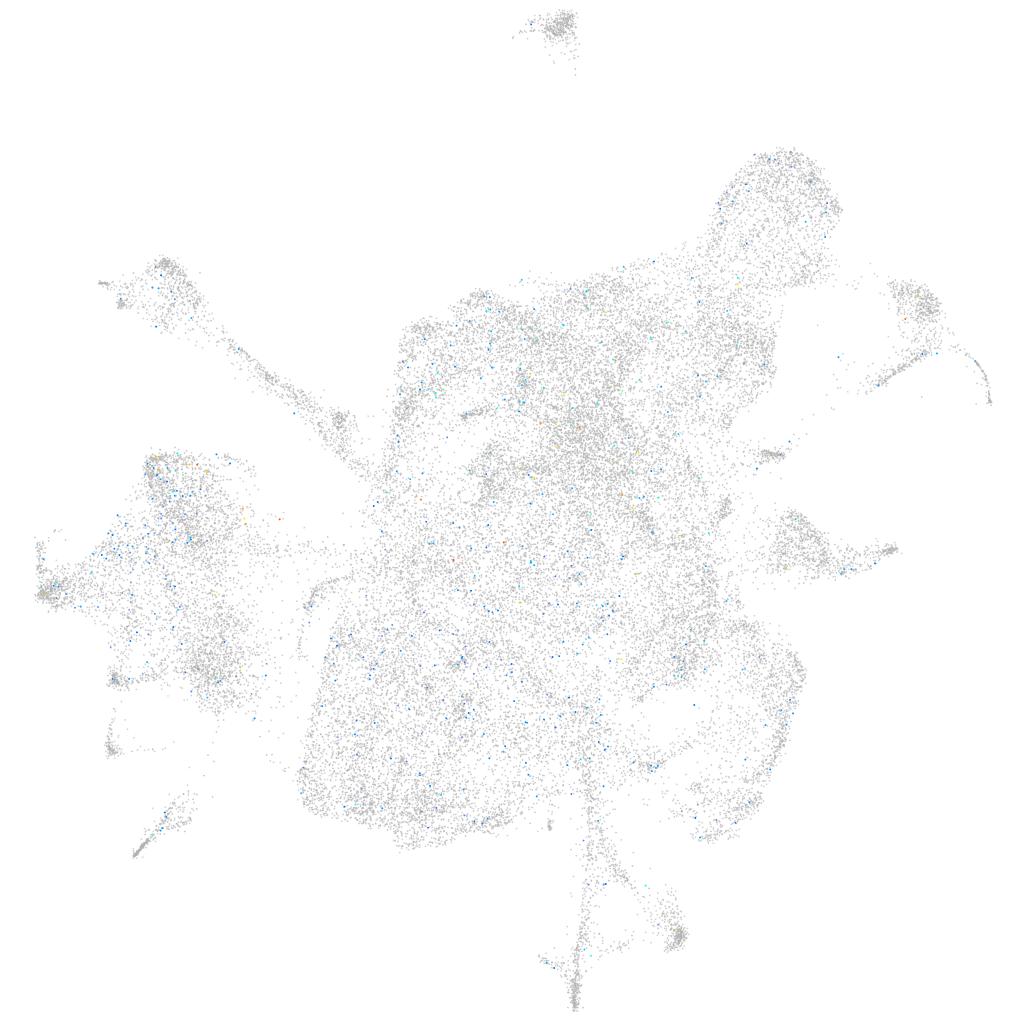
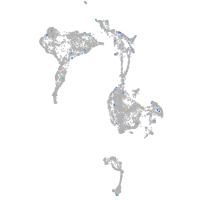
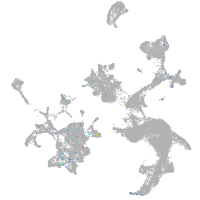
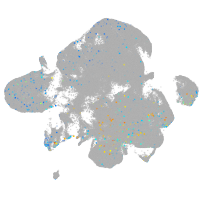
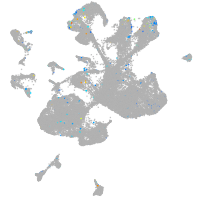
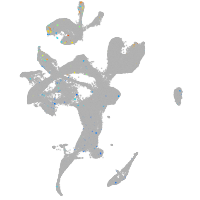
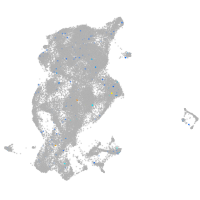
Gene expression UMAP
Display:
Expression
Stage
Other cell groups
all cells
blastomeres
PGCs
endoderm
axial mesoderm
muscle
mural cells /
non-skeletal muscle
mesenchyme
hematopoietic /
vasculature
pronephros
neural
spinal cord / glia
eye
taste / olfactory
otic / lateral line
epidermis
periderm
fin
ionocytes / mucous
pigment cells
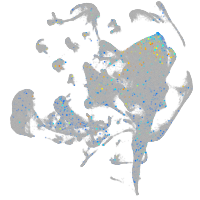
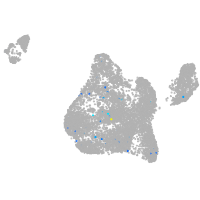
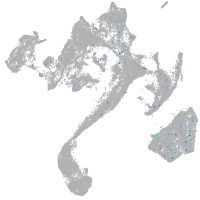
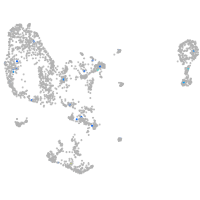
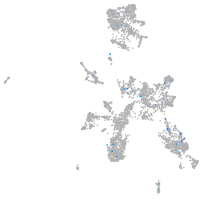
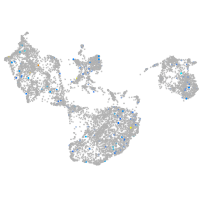
Expression by stage/cluster
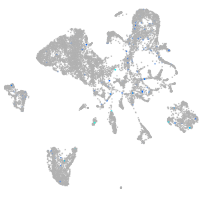
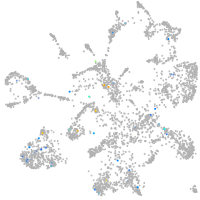
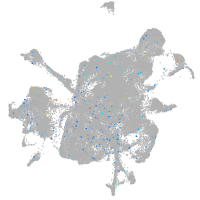
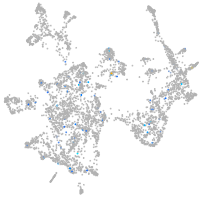
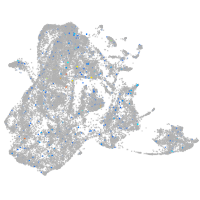
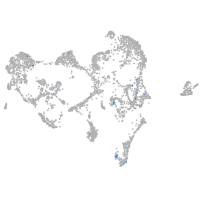
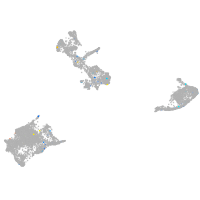
Correlated gene expression
Positive correlation
Negative correlation
Gene
r
Gene
r
BX649398.3
0.070
rps7
-0.024
CU571315.3
0.065
si:dkey-151g10.6
-0.024
BX548060.1
0.061
rps24
-0.023
CU464134.1
0.060
rpl28
-0.022
CABZ01078989.1
0.055
rpl34
-0.022
LOC103910793
0.053
rps19
-0.020
LOC101885678
0.051
rpl19
-0.020
LOC101883563
0.051
rpl39
-0.019
si:dkey-27d5.5
0.049
rpl31
-0.019
muc5f
0.048
rpl10
-0.018
CABZ01070852.1
0.047
rplp2l
-0.018
LOC110437896
0.045
rpl38
-0.017
pea15
0.045
rpl26
-0.017
nefma
0.044
rps13
-0.016
LOC103911208
0.043
rpl7
-0.016
XLOC-022611
0.042
rpl11
-0.015
fhad1
0.042
faua
-0.014
syngr3a
0.042
sparc
-0.014
sv2a
0.041
rps15a
-0.014
ywhag2
0.041
rps16
-0.014
si:dkeyp-4f2.1
0.041
rpl36
-0.014
XLOC-015437
0.040
zgc:195173
-0.014
LOC100537874
0.040
rps23
-0.014
CABZ01021532.1
0.040
rps10
-0.014
RASGRF1
0.040
rpl37
-0.013
bsnb
0.040
rpl13a
-0.013
si:ch211-218d20.15
0.040
rps5
-0.013
grk7b
0.039
rpl36a
-0.013
kcnc1b
0.039
rps6
-0.013
npr1b
0.039
rpl35
-0.013
map1aa
0.039
si:ch211-243a20.3
-0.013
CT583728.24
0.039
rpl23
-0.013
si:ch211-59d17.3
0.038
rpl9
-0.013
BX324181.1
0.038
rpl18a
-0.013
elavl4
0.038
cdc20
-0.013