Daniocell
si:dkey-6n21.13 (mural cells / non-skeletal muscle)
si:dkey-6n21.13
ZFIN
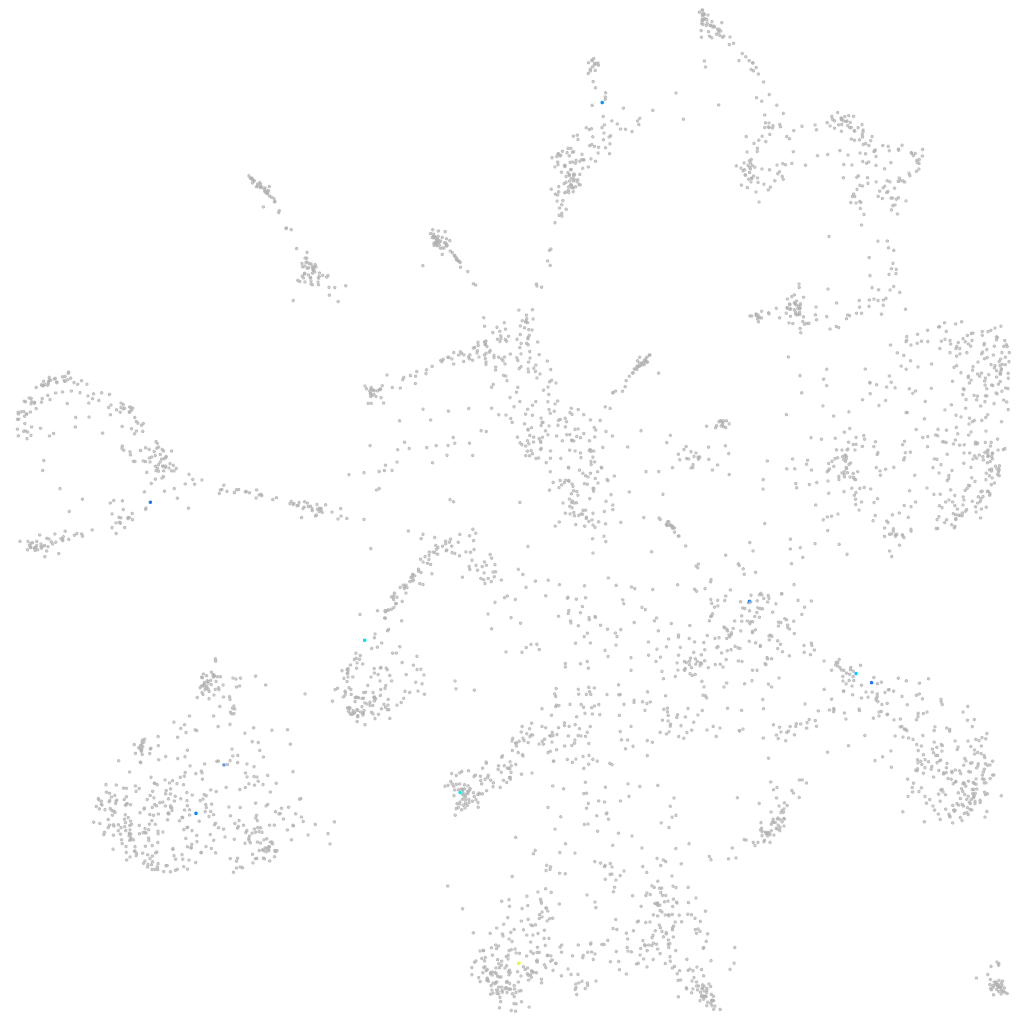
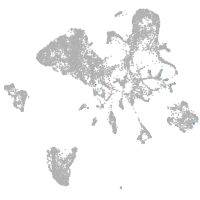
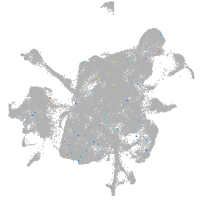
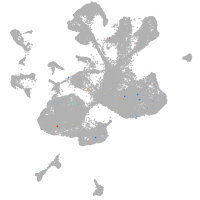
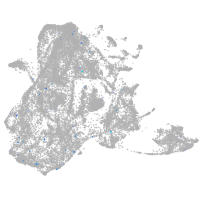
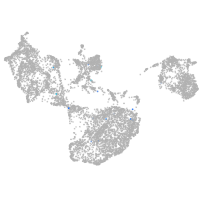
Gene expression UMAP
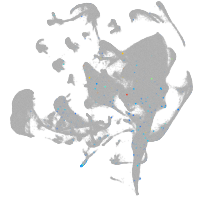
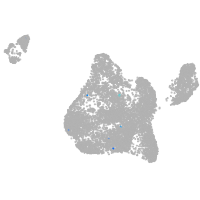
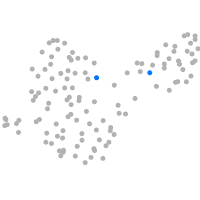
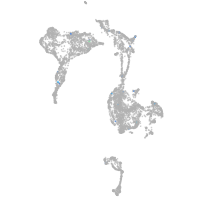
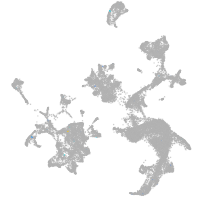
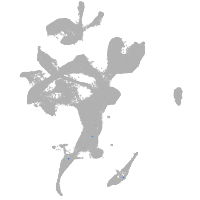
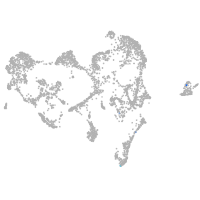
Display:
Expression
Stage
Other cell groups
all cells
blastomeres
PGCs
endoderm
axial mesoderm
muscle
mural cells /
non-skeletal muscle
mesenchyme
hematopoietic /
vasculature
pronephros
neural
spinal cord / glia
eye
taste / olfactory
otic / lateral line
epidermis
periderm
fin
ionocytes / mucous
pigment cells
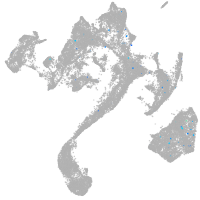
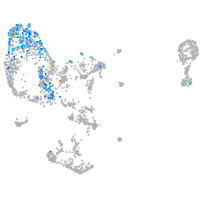
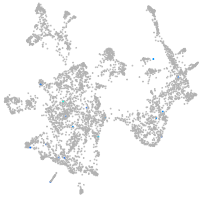
Expression by stage/cluster
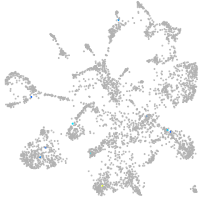
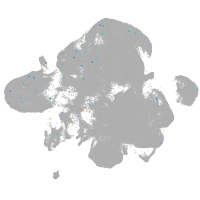
Correlated gene expression
Positive correlation
Negative correlation
Gene
r
Gene
r
XLOC-030307
0.529
mylpfa
-0.030
CABZ01067557.1
0.426
gstt1b
-0.029
LOC110437883
0.355
stom
-0.028
LOC101885837
0.237
si:ch211-286o17.1
-0.028
LOC103910167
0.237
snai1a
-0.027
zgc:113142
0.237
lama4
-0.027
uts2b
0.227
rps27.2
-0.026
fech
0.227
mab21l2
-0.026
si:dkey-81p22.11
0.225
XLOC-044191
-0.026
si:dkey-201g16.1
0.215
cavin2b
-0.026
mpp3b
0.215
si:ch211-212k18.9
-0.026
fbxl3l
0.212
zfhx3
-0.025
ACVR1C
0.200
daam1a
-0.025
LOC101886199
0.200
atox1
-0.025
BX649533.1
0.185
LOC103910438
-0.025
si:dkey-3p4.8
0.185
lrrc17
-0.025
XLOC-022924
0.180
mmp2
-0.024
LOC110438155
0.171
tmem176
-0.024
si:ch211-284o19.8
0.171
col12a1a
-0.024
kcnk7
0.170
tspan18b
-0.024
XLOC-001742
0.158
celf2
-0.024
map4k2
0.148
hbbe1.1
-0.024
CABZ01043953.1.1
0.145
icn
-0.023
pimr189
0.143
pdgfrb
-0.023
si:dkey-23n7.10
0.141
si:ch211-260e23.9
-0.023
c1galt1a
0.140
psma1
-0.023
si:dkey-23a13.9
0.139
ednraa
-0.023
LOC101885470
0.139
mcamb
-0.023
LOC101885611
0.138
ehd1b
-0.022
LOC107195253
0.136
ccdc187
-0.022
si:dkey-5n7.2
0.135
zgc:66433
-0.022
vwa5b1
0.130
pmp22a
-0.022
zgc:194621
0.129
appa
-0.022
spry1
0.127
adipor2
-0.022
zgc:163121
0.124
si:dkey-9i23.16
-0.022