Daniocell
si:dkey-3k24.5 (hematopoietic / vasculature)
si:dkey-3k24.5 [Source:ZFIN;Acc:ZDB-GENE-111102-3]
ZFIN
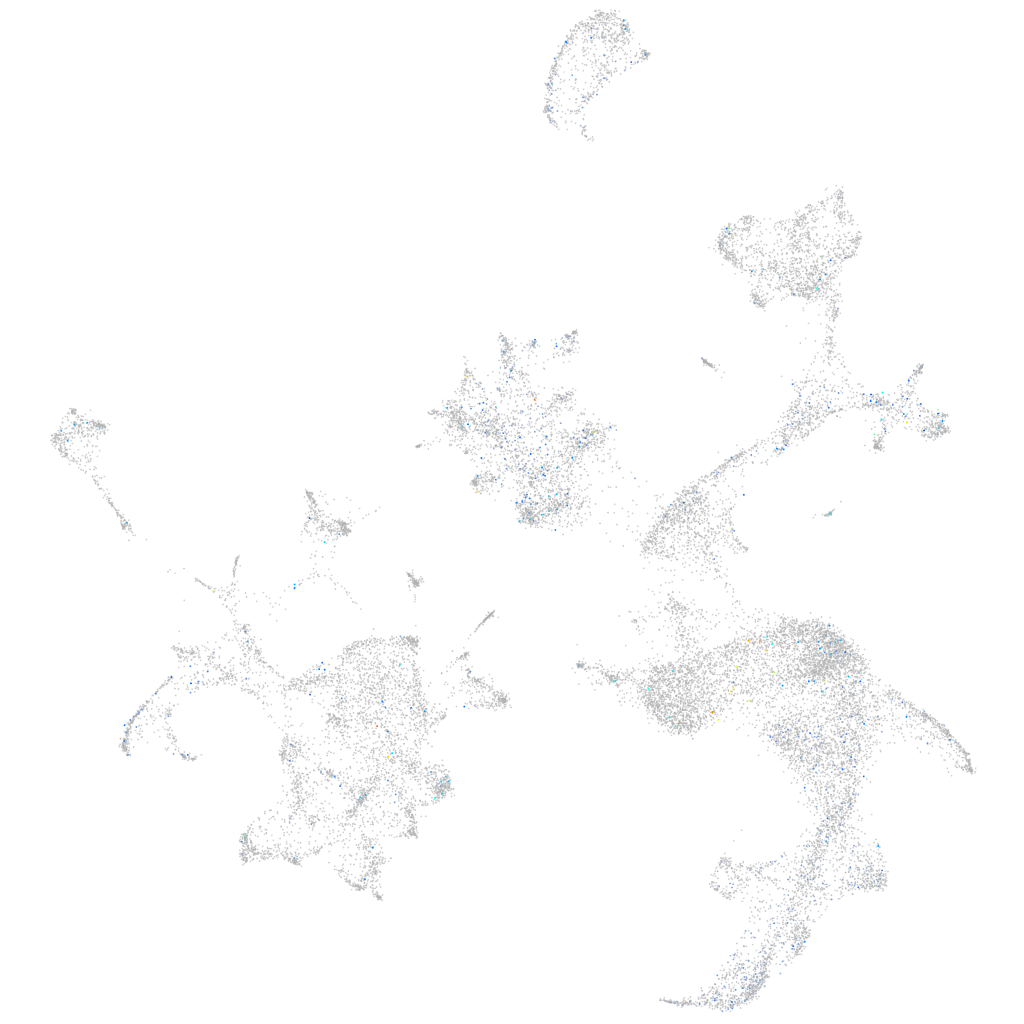
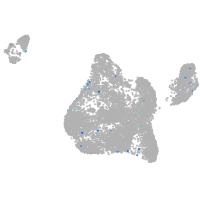
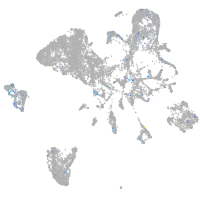
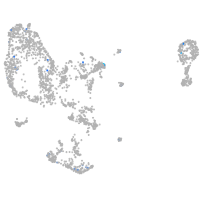
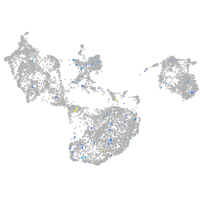
Gene expression UMAP
Display:
Expression
Stage
Other cell groups
all cells
blastomeres
PGCs
endoderm
axial mesoderm
muscle
mural cells /
non-skeletal muscle
mesenchyme
hematopoietic /
vasculature
pronephros
neural
spinal cord / glia
eye
taste / olfactory
otic / lateral line
epidermis
periderm
fin
ionocytes / mucous
pigment cells
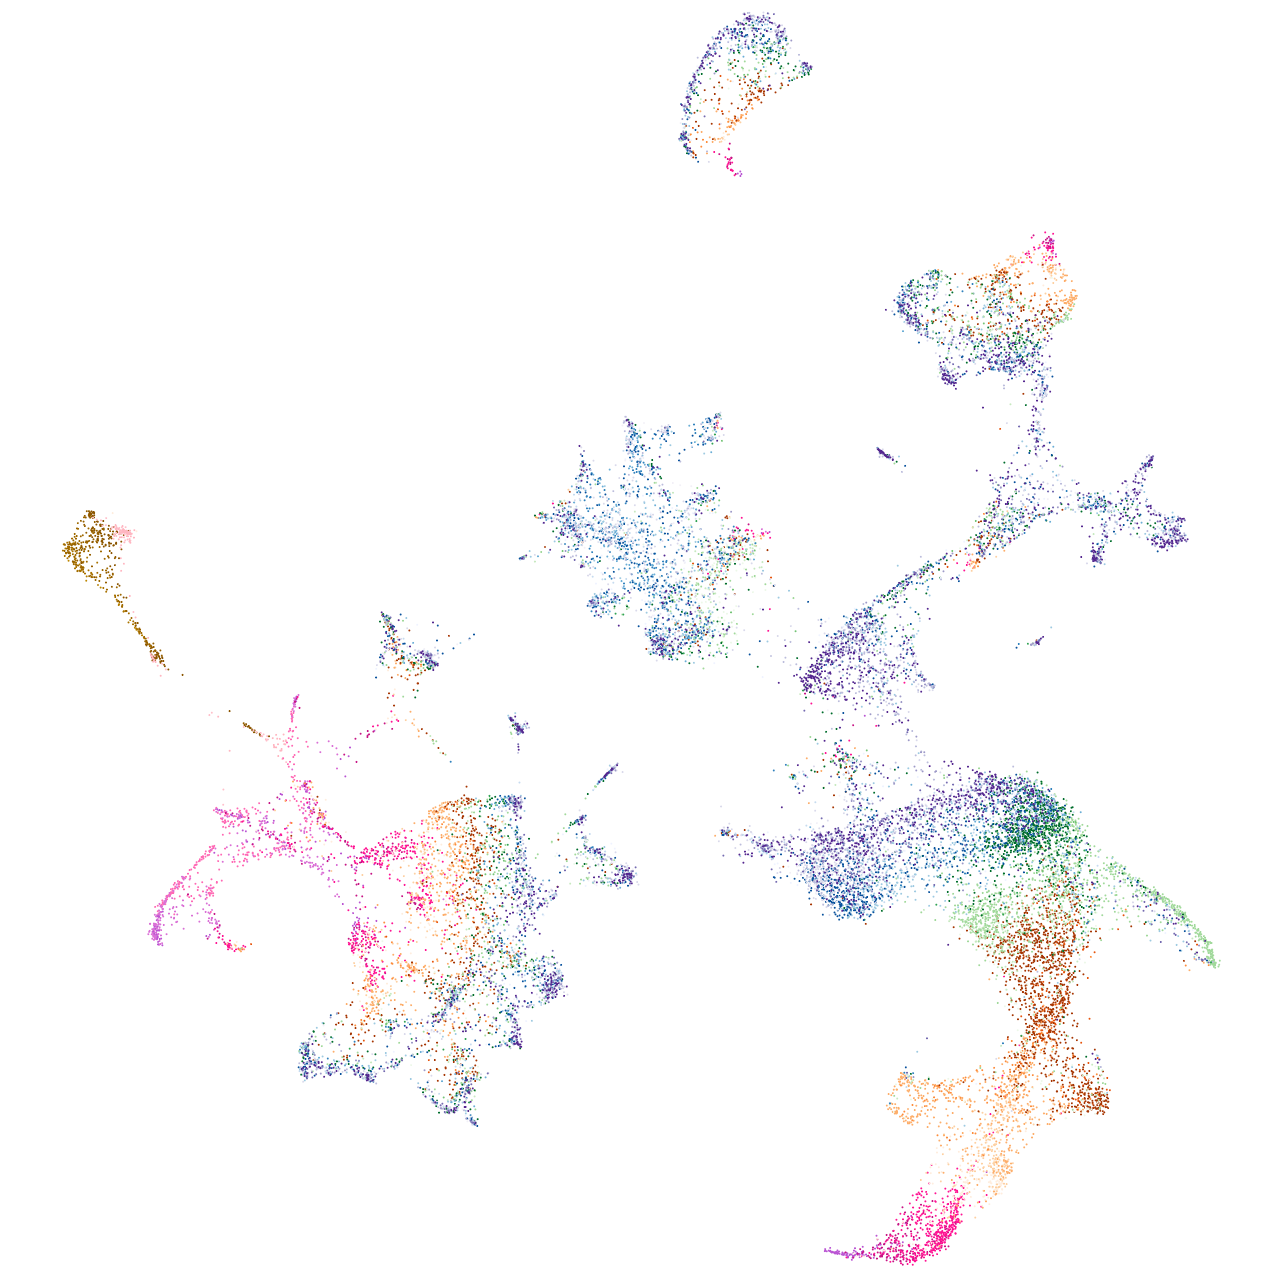
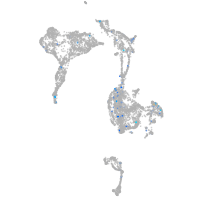
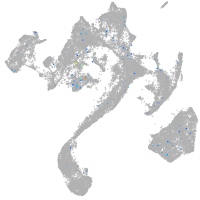
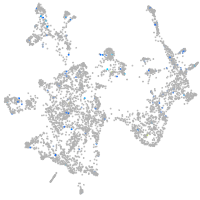
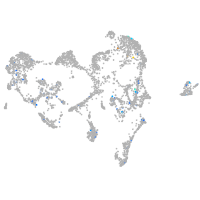
Expression by stage/cluster
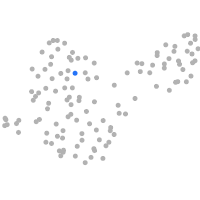
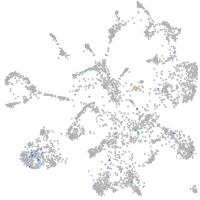
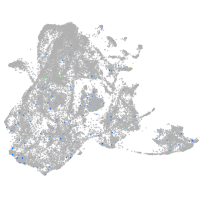
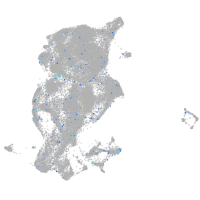
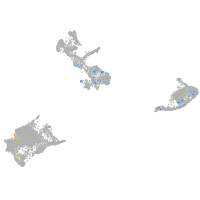
Correlated gene expression
Positive correlation
Negative correlation
Gene
r
Gene
r
CU469530.2
0.113
krt8
-0.028
zgc:175280
0.096
stab2
-0.027
XLOC-040494
0.088
mrc1a
-0.026
BX908799.1
0.084
abcg2a
-0.026
si:ch211-152f22.4
0.083
ctsla
-0.026
CR318653.1
0.082
tnnt3b
-0.025
LO017955.1
0.079
si:ch211-248e11.2
-0.025
CR788254.3
0.079
clec14a
-0.025
LOC103909620
0.075
flt4
-0.025
nptx2a
0.073
si:dkeyp-97a10.2
-0.024
si:dkey-161j23.6
0.071
she
-0.024
XLOC-024493
0.069
cdh5
-0.024
si:dkeyp-77c8.4
0.064
krt18a.1
-0.024
si:ch73-54f23.4
0.064
gpr182
-0.023
si:ch211-195b13.6
0.062
fabp11a
-0.023
ap1s3a
0.062
kdr
-0.023
FO744840.1
0.061
dab2
-0.022
tlr2
0.061
thsd1
-0.022
si:ch211-127b6.2
0.060
pora
-0.022
ddx58
0.060
ecscr
-0.022
ndp
0.059
pcdh12
-0.022
LOC565594
0.059
XLOC-016094
-0.022
XLOC-020693
0.059
npl
-0.022
pmt
0.058
lyve1b
-0.022
LOC103911518
0.058
fgd5a
-0.022
nyx
0.057
CELA1 (1 of many)
-0.021
slc4a10b
0.057
eppk1
-0.021
LOC110438400
0.057
rasip1
-0.021
LOC110437915
0.057
tie1
-0.021
LOC101887106
0.055
ramp2
-0.021
eno2
0.055
tspan4b
-0.021
cacna1da
0.054
si:ch211-194m7.3
-0.021
si:ch1073-159d7.10
0.054
fuca1.1
-0.021
si:ch211-133h13.1
0.054
tpm4a
-0.021
si:ch211-229b6.1
0.054
ednraa
-0.020