Daniocell
si:dkey-103e21.5 (neural)
si:dkey-103e21.5 [Source:ZFIN;Acc:ZDB-GENE-060526-186]
ZFIN
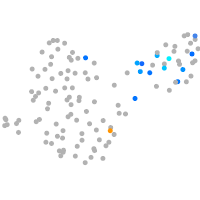
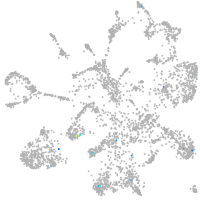
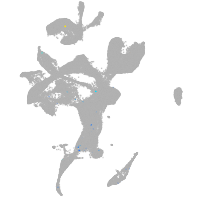
Gene expression UMAP
Display:
Expression
Stage
Other cell groups
all cells
blastomeres
PGCs
endoderm
axial mesoderm
muscle
mural cells /
non-skeletal muscle
mesenchyme
hematopoietic /
vasculature
pronephros
neural
spinal cord / glia
eye
taste / olfactory
otic / lateral line
epidermis
periderm
fin
ionocytes / mucous
pigment cells
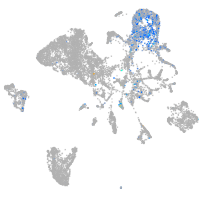
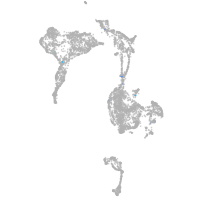
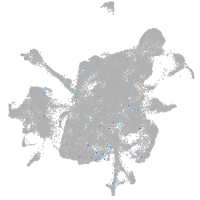
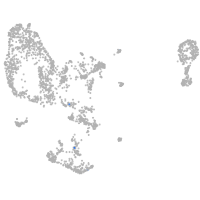
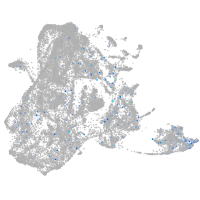
Expression by stage/cluster
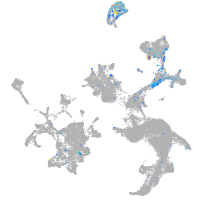
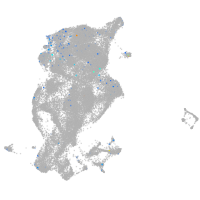
Correlated gene expression
Positive correlation
Negative correlation
Gene
r
Gene
r
wu:fb64b08
0.120
marcksl1b
-0.016
si:ch211-195b13.6
0.098
stx1b
-0.012
tor1l3
0.086
tuba1c
-0.012
LOC101882287
0.086
elavl3
-0.012
ms4a17a.5
0.082
si:dkey-276j7.1
-0.012
irf1a
0.081
rtn1a
-0.012
si:dkey-225k4.1
0.078
sncb
-0.012
LOC100330348
0.078
ptmab
-0.012
si:ch211-106j21.6
0.077
ppp3r1a
-0.011
zgc:153654
0.077
mdkb
-0.011
ccl25a
0.075
nrxn1a
-0.011
LOC108181504
0.075
fam49al
-0.011
mapkapk2b
0.072
gng3
-0.011
si:ch211-183d5.2
0.068
ywhag2
-0.011
cyp8b3
0.067
tmsb
-0.011
snx20
0.066
si:ch73-1a9.3
-0.010
slc2a5
0.065
gng2
-0.010
ccl19b
0.064
rtn1b
-0.010
calml4a
0.063
stmn2a
-0.010
si:ch211-278p9.2
0.063
palm1b
-0.010
ccl20b
0.060
id4
-0.010
mhc1lja
0.059
ywhah
-0.010
sult1st6
0.058
hmgb3a
-0.010
LOC110439013
0.058
myt1la
-0.010
zgc:194007
0.056
nsg2
-0.010
mxc
0.053
zc4h2
-0.010
CABZ01002349.1
0.052
stxbp1a
-0.010
LOC110438516
0.052
si:dkeyp-75h12.5
-0.010
si:ch73-308m11.1
0.051
nova2
-0.010
sult5a1
0.051
cplx2
-0.009
BX004785.3
0.050
atp6v0cb
-0.009
LOC103911924
0.050
gpc1a
-0.009
XLOC-016089
0.050
ptprga
-0.009
XLOC-002639
0.050
stmn1b
-0.009
mxe
0.050
cadm4
-0.009