Daniocell
si:ch73-36p18.1 (blastomeres)
si:ch73-36p18.1
ZFIN
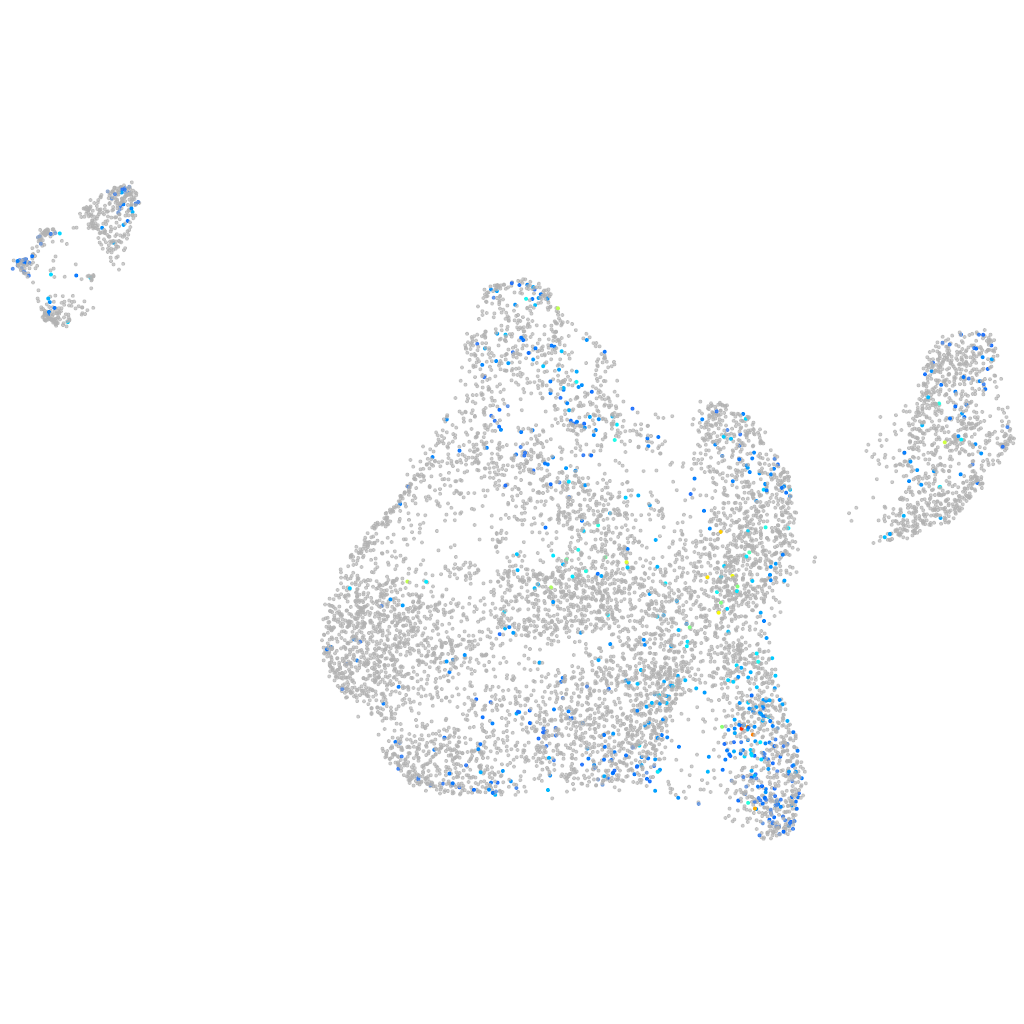
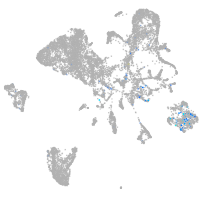
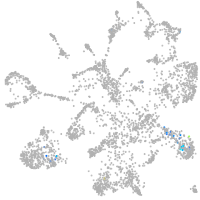
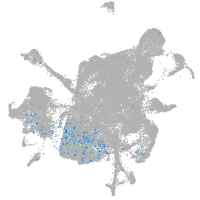
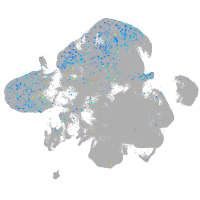
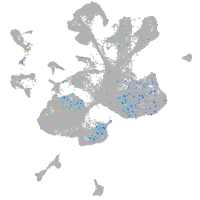
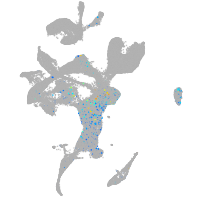
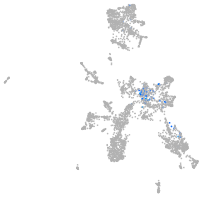
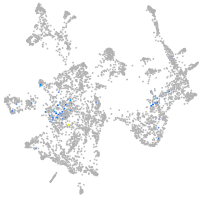
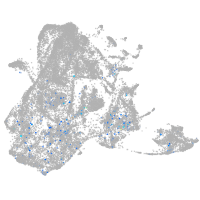
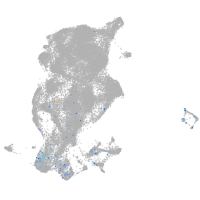
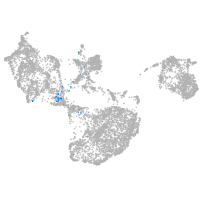
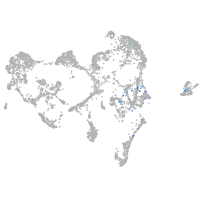
Gene expression UMAP
Display:
Expression
Stage
Other cell groups
all cells
blastomeres
PGCs
endoderm
axial mesoderm
muscle
mural cells /
non-skeletal muscle
mesenchyme
hematopoietic /
vasculature
pronephros
neural
spinal cord / glia
eye
taste / olfactory
otic / lateral line
epidermis
periderm
fin
ionocytes / mucous
pigment cells
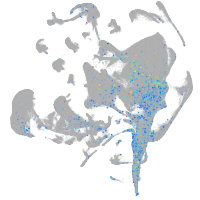
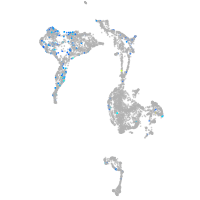
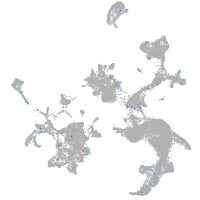
Expression by stage/cluster
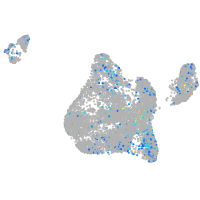
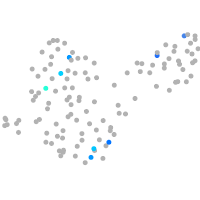
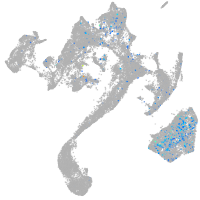
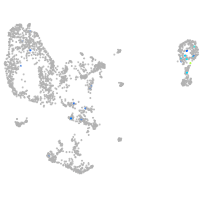
Correlated gene expression
Positive correlation
Negative correlation
Gene
r
Gene
r
zgc:153405
0.230
mt-cyb
-0.087
si:ch211-113a14.18
0.228
mt-co2
-0.084
si:dkey-108k21.14
0.215
COX3
-0.084
si:ch1073-153i20.4
0.215
h3f3d
-0.083
si:dkey-261m9.12
0.213
snrpb
-0.071
si:dkey-108k21.10
0.208
ddx39ab
-0.070
si:dkey-23a13.17
0.197
h2afvb
-0.061
si:ch211-113a14.24
0.196
srsf3b
-0.060
si:dkey-108k21.21
0.193
rbm4.3
-0.058
si:ch73-368j24.12
0.177
hnrnpabb
-0.058
zgc:110216
0.173
cirbpb
-0.056
si:ch1073-159d7.7
0.162
gar1
-0.056
zgc:110425
0.147
BX957251.1
-0.053
si:dkey-23a13.9
0.139
srsf1a
-0.051
si:ch73-368j24.11
0.138
rpl19
-0.049
si:ch1073-153i20.5
0.129
rbm8a
-0.049
LOC569982
0.125
eif4a3
-0.048
hist1h2a6
0.115
khdrbs1a
-0.047
XLOC-004932
0.110
actb1
-0.047
zgc:194989
0.108
rpl4
-0.047
akap12b
0.103
ube2c
-0.047
NC-002333.17
0.099
sap18
-0.046
mki67
0.098
zgc:56095
-0.046
XLOC-009562
0.097
rpl7
-0.046
XLOC-016203
0.086
rpl12
-0.045
wfs1a
0.084
ewsr1a
-0.045
hist1h2a1
0.083
edf1
-0.045
trim63a
0.083
tpt1
-0.044
tprb
0.080
dkc1
-0.044
LOC110437802
0.080
si:dkeyp-114g9.1
-0.042
GAA
0.079
si:dkey-23i12.5
-0.042
ncl
0.079
gabpa
-0.041
CABZ01072614.1
0.079
rpl10
-0.041
klf1
0.078
aldob
-0.041
CR550302.1
0.078
psmc5
-0.041