Daniocell
si:ch73-335m24.5 (blastomeres)
si:ch73-335m24.5 [Source:ZFIN;Acc:ZDB-GENE-100922-39]
ZFIN
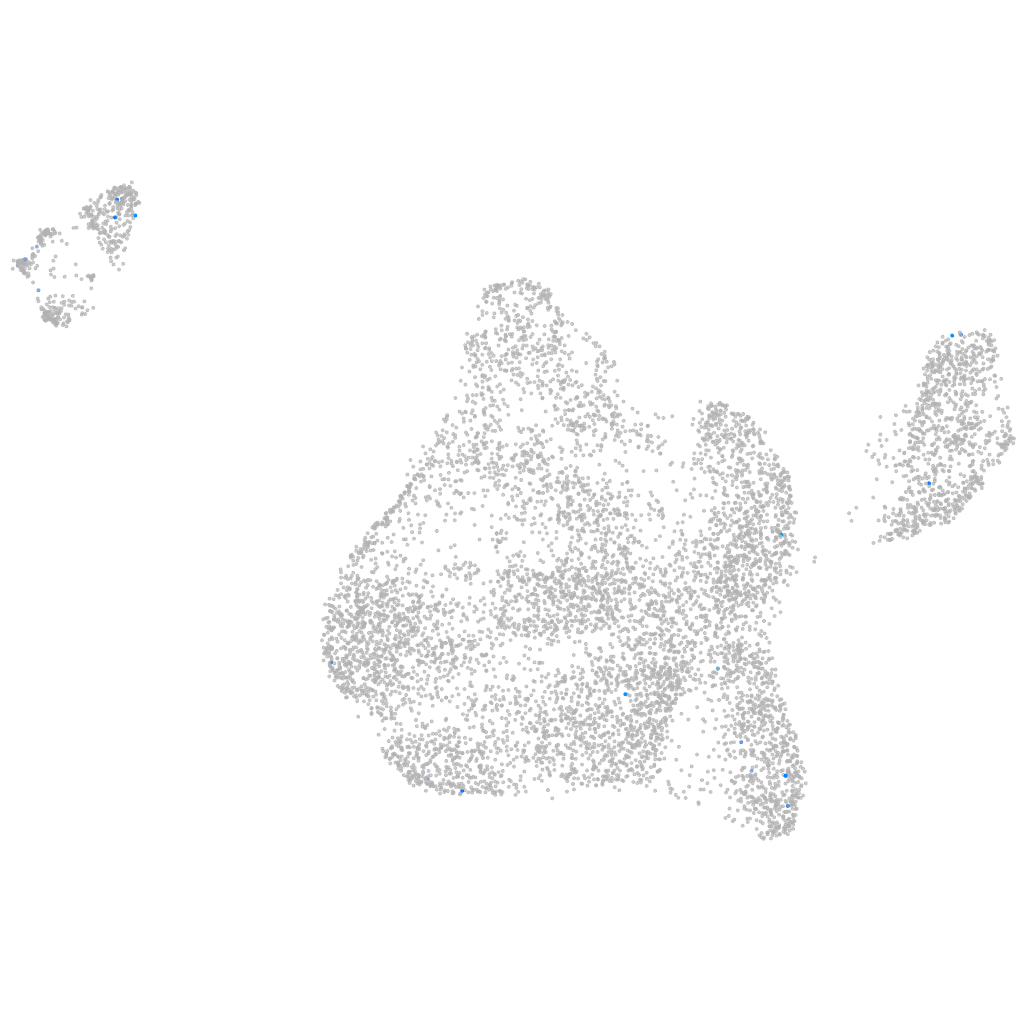
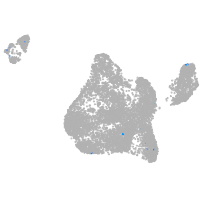
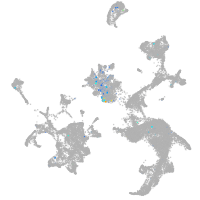
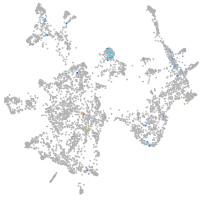
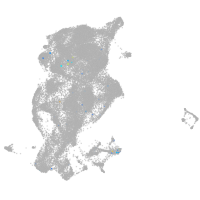
Gene expression UMAP
Display:
Expression
Stage
Other cell groups
all cells
blastomeres
PGCs
endoderm
axial mesoderm
muscle
mural cells /
non-skeletal muscle
mesenchyme
hematopoietic /
vasculature
pronephros
neural
spinal cord / glia
eye
taste / olfactory
otic / lateral line
epidermis
periderm
fin
ionocytes / mucous
pigment cells
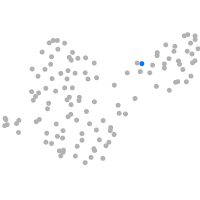
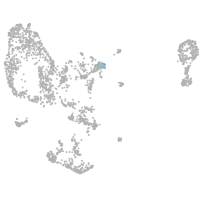
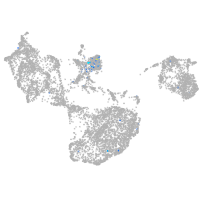
Expression by stage/cluster
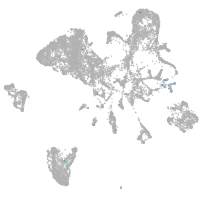
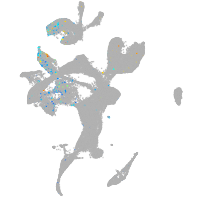
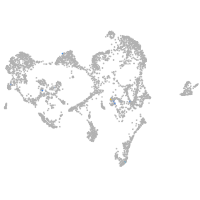
Correlated gene expression
Positive correlation
Negative correlation
Gene
r
Gene
r
pax2b
0.309
marcksl1b
-0.050
blnk
0.296
hnrnpa0b
-0.050
shank2
0.292
rpl35
-0.049
dlk2
0.228
rps25
-0.048
trim109
0.224
si:ch211-222l21.1
-0.046
abcc2
0.181
si:ch73-1a9.3
-0.045
pkd1a
0.178
rps18
-0.045
LOC110439898
0.175
rhoab
-0.044
BX927257.1
0.168
hmgn6
-0.044
BX640549.1
0.163
hspb1
-0.043
arhgap22
0.160
hmgb2a
-0.043
lingo1a
0.158
CR383676.1
-0.043
tmem163a
0.155
rps6
-0.042
crygm6
0.153
rps11
-0.042
BX005073.1
0.153
stm
-0.041
cryba4
0.152
rpl32
-0.041
si:dkey-190g11.3
0.140
rps2
-0.041
si:dkey-187j14.6
0.132
eef1a1l1
-0.040
traf2a
0.132
ybx1
-0.040
pcdh2ab9
0.130
sec61g
-0.040
zgc:153031
0.129
dynll1
-0.039
XLOC-026715
0.127
hmgb2b
-0.039
adm2b
0.125
psma4
-0.038
slc35d2
0.124
rps26l
-0.038
LOC101886621
0.124
akap12b
-0.038
calcrla
0.120
rplp1
-0.038
phka2
0.120
si:dkey-151g10.6
-0.037
gpr61
0.118
si:ch211-137a8.4
-0.037
rhcgb
0.118
hmga1a
-0.037
si:ch211-38m6.6
0.114
rpl36
-0.037
si:dkey-151p11.2
0.114
si:dkey-56m19.5
-0.036
tnfaip8l3
0.110
nop53
-0.036
LOC108190816
0.110
snrpf
-0.036
LOC566055
0.110
seta
-0.035
nitr6b
0.110
rps15a
-0.035