Daniocell
si:ch73-27e22.1 (mural cells / non-skeletal muscle)
si:ch73-27e22.1
ZFIN
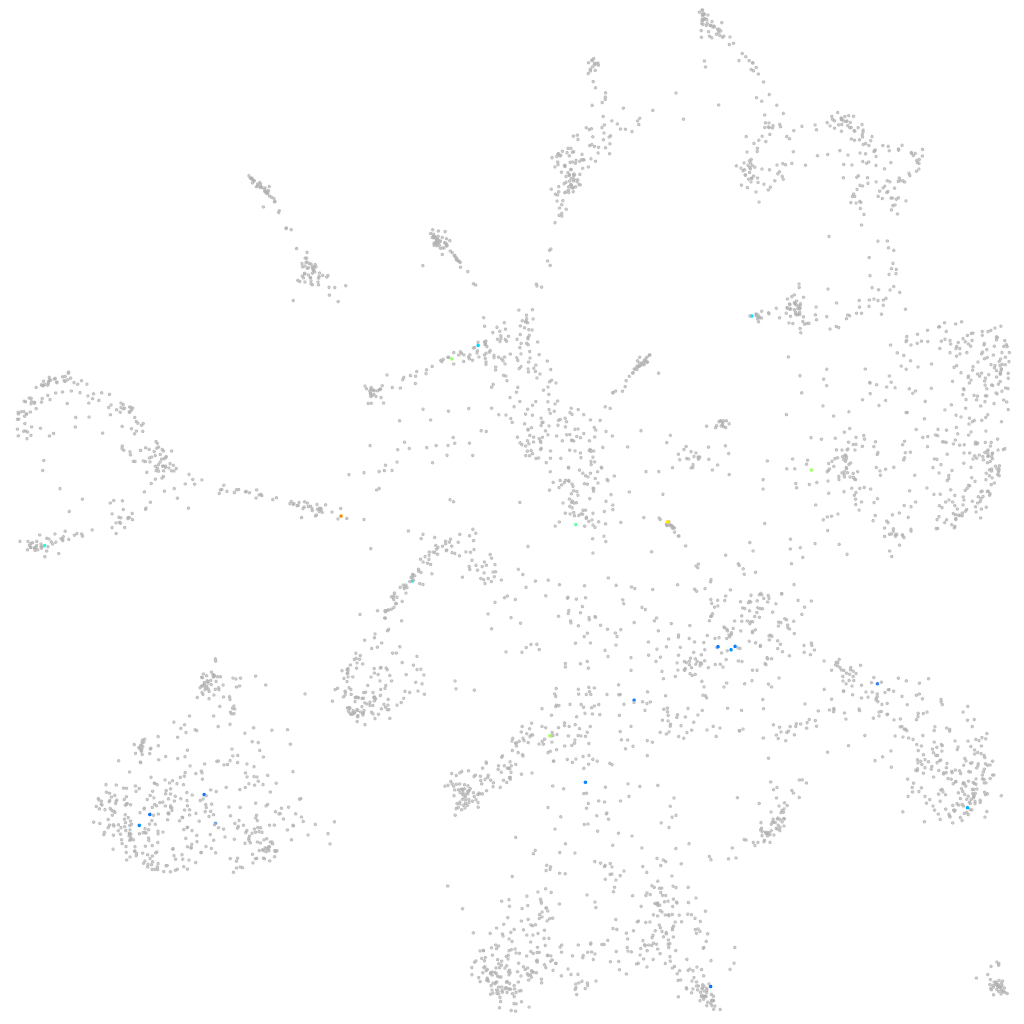
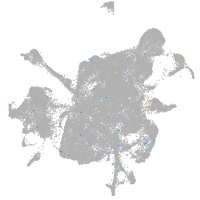
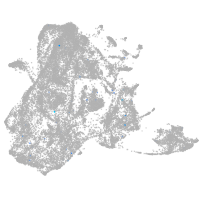
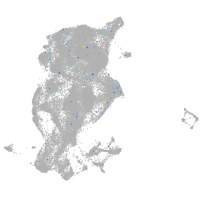
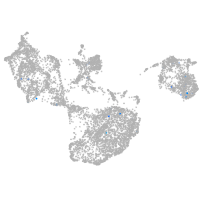
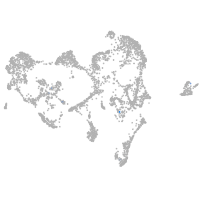
Gene expression UMAP
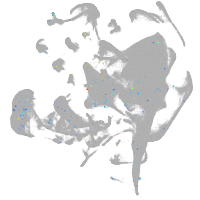
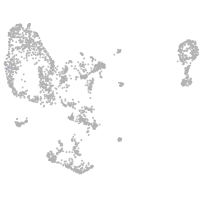
Display:
Expression
Stage
Other cell groups
all cells
blastomeres
PGCs
endoderm
axial mesoderm
muscle
mural cells /
non-skeletal muscle
mesenchyme
hematopoietic /
vasculature
pronephros
neural
spinal cord / glia
eye
taste / olfactory
otic / lateral line
epidermis
periderm
fin
ionocytes / mucous
pigment cells
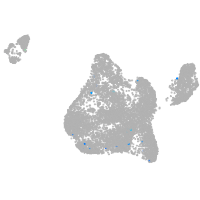
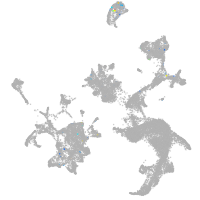
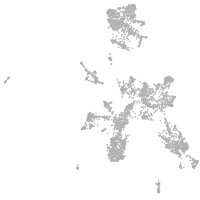
Expression by stage/cluster
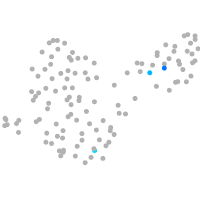
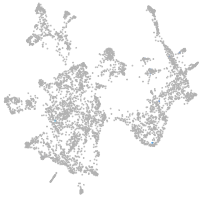
Correlated gene expression
Positive correlation
Negative correlation
Gene
r
Gene
r
CABZ01044154.1
0.363
rbpms2a
-0.040
BX510922.2
0.318
cast
-0.036
soat2
0.281
jam2b
-0.033
FP236454.1
0.281
myhz1.1
-0.032
CABZ01102517.1
0.252
podxl
-0.032
si:dkey-148a17.6
0.242
pvalb2
-0.032
XLOC-021399
0.236
tln1
-0.032
CABZ01073083.1
0.236
CABZ01113812.1
-0.031
si:dkey-194g4.1
0.235
krt4
-0.030
CT476811.1
0.231
map1lc3b
-0.030
si:ch211-214k5.3
0.226
krt91
-0.030
CABZ01069022.1
0.213
mrpl32
-0.030
lygl2
0.207
arglu1a
-0.030
LOC559196
0.205
fn1a
-0.030
BX119992.1
0.201
ociad2
-0.030
XLOC-043765
0.199
actn4
-0.029
slc5a11
0.193
syap1
-0.029
XLOC-035147
0.192
krtt1c19e
-0.029
LOC100000890
0.182
cyt1
-0.029
si:ch73-62b13.1
0.178
tmsb1
-0.029
fam131c
0.178
itga5
-0.029
scin
0.175
stau2
-0.029
XLOC-039146
0.165
rpl6
-0.029
trim35-29
0.160
ip6k2b
-0.028
nts
0.157
prkar2aa
-0.028
si:dkey-13e3.1
0.155
tmem167a
-0.028
XLOC-020172
0.155
pim1
-0.028
upk1a
0.154
dab2ipb
-0.028
XLOC-022751
0.154
ndufb4
-0.028
bhlha9
0.151
ctnnd1
-0.028
si:ch211-240l19.6
0.144
ndufs5
-0.028
tbx22
0.142
ndufb5
-0.027
TP53I3
0.142
NC-002333.17
-0.027
cdkl5
0.139
luzp1
-0.027
b3gnt5b
0.138
fosl1a
-0.027