Daniocell
si:ch211-264f5.8 (hematopoietic / vasculature)
si:ch211-264f5.8
ZFIN
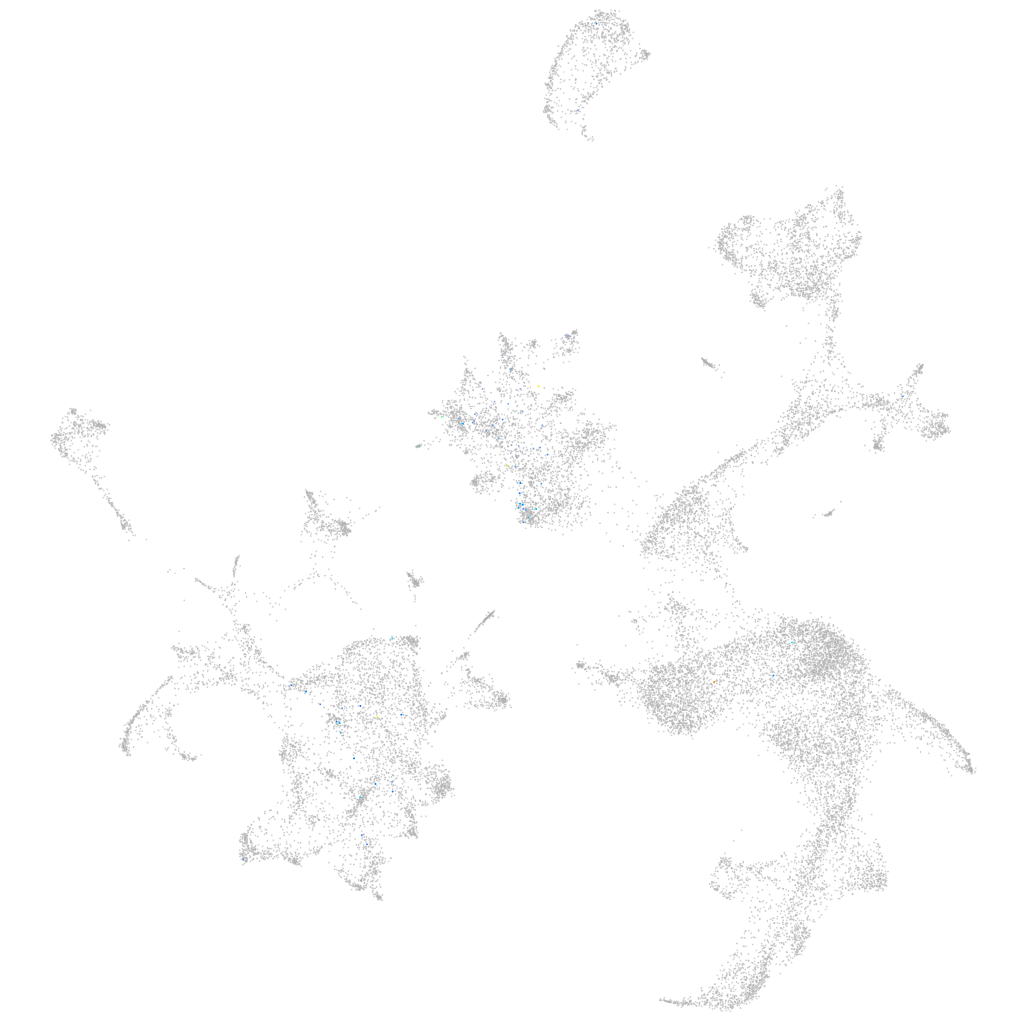
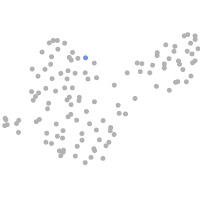
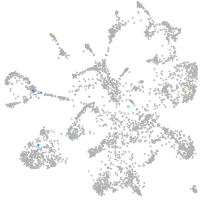
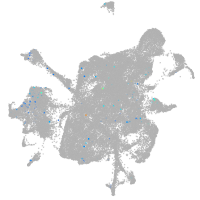
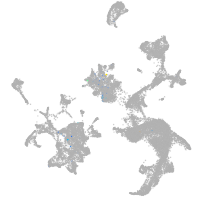
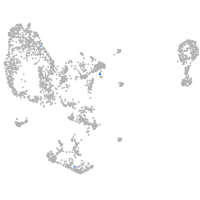
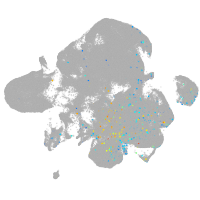
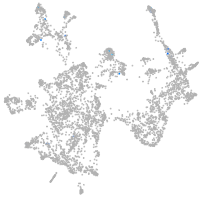
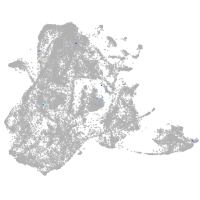
Gene expression UMAP
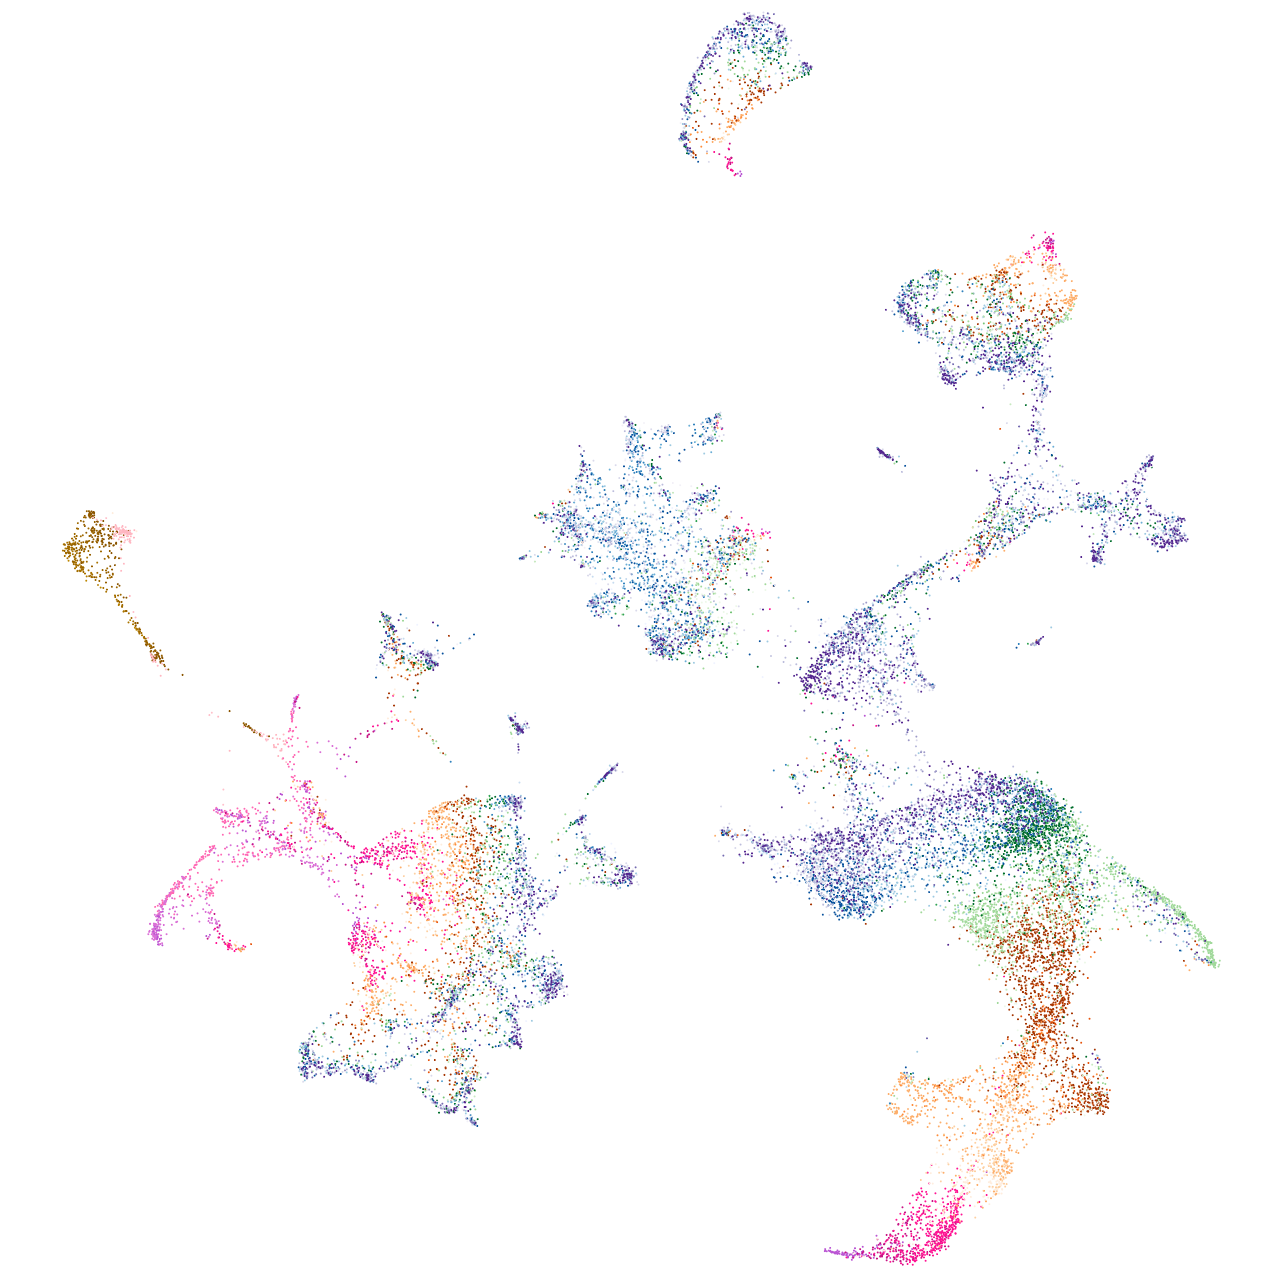
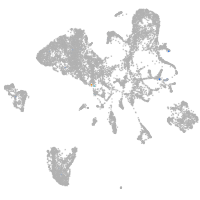
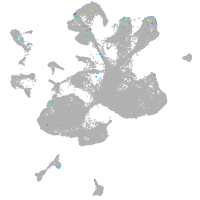
Display:
Expression
Stage
Other cell groups
all cells
blastomeres
PGCs
endoderm
axial mesoderm
muscle
mural cells /
non-skeletal muscle
mesenchyme
hematopoietic /
vasculature
pronephros
neural
spinal cord / glia
eye
taste / olfactory
otic / lateral line
epidermis
periderm
fin
ionocytes / mucous
pigment cells
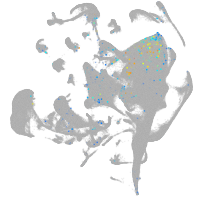
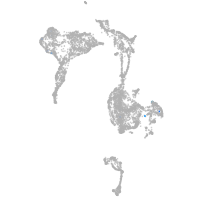
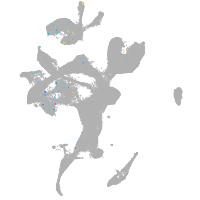
Expression by stage/cluster
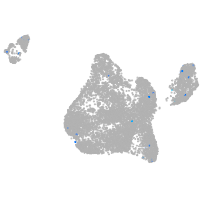
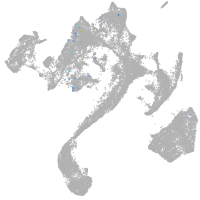
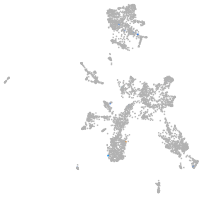
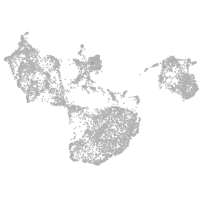
Correlated gene expression
Positive correlation
Negative correlation
Gene
r
Gene
r
BX323461.1
0.202
hbbe3
-0.022
XLOC-040073
0.195
urod
-0.021
CABZ01034089.1
0.187
metap2b
-0.020
dclk2b
0.153
slc4a1a
-0.020
CU182823.1
0.142
uros
-0.018
LOC103910762
0.138
slc11a2
-0.018
LOC101883466
0.137
glrx5
-0.018
LOC101883010
0.129
hmbsa
-0.017
XLOC-021256
0.128
blf
-0.017
fxyd6
0.127
hmbsb
-0.016
CU915770.1
0.127
nop2
-0.016
lrit3a
0.122
tfr1a
-0.016
XLOC-032954
0.119
anxa11a
-0.016
LO017643.1
0.114
CR293511.1
-0.016
si:dkey-199k11.6
0.113
cldng
-0.016
prob1
0.110
gar1
-0.016
XLOC-024447
0.110
tmem14ca
-0.015
dpp6a
0.109
si:dkeyp-120h9.1
-0.015
trpm2-as
0.108
ebna1bp2
-0.015
tbr1a
0.105
laptm5
-0.015
CABZ01015105.1
0.102
impdh2
-0.015
gprc5ba
0.098
nt5c2l1
-0.015
LOC101884441
0.098
rpl7l1
-0.014
XLOC-033065
0.096
blvra
-0.014
LOC100331268
0.093
cd83
-0.014
trim66
0.093
slc25a37
-0.014
amigo1
0.091
ptpn6
-0.014
rdh20
0.091
tspo
-0.014
CABZ01071056.1
0.091
rbm28
-0.014
LOC103910521
0.090
klf17
-0.014
ensaa
0.089
mibp2
-0.014
si:ch73-187m15.4
0.088
znf593
-0.014
myrip
0.088
vbp1
-0.014
zgc:65894
0.087
mthfd2
-0.014
CR450727.1
0.087
zgc:163057
-0.014