Daniocell
si:ch211-238n5.4 (fin)
si:ch211-238n5.4 [Source:ZFIN;Acc:ZDB-GENE-050419-80]
ZFIN
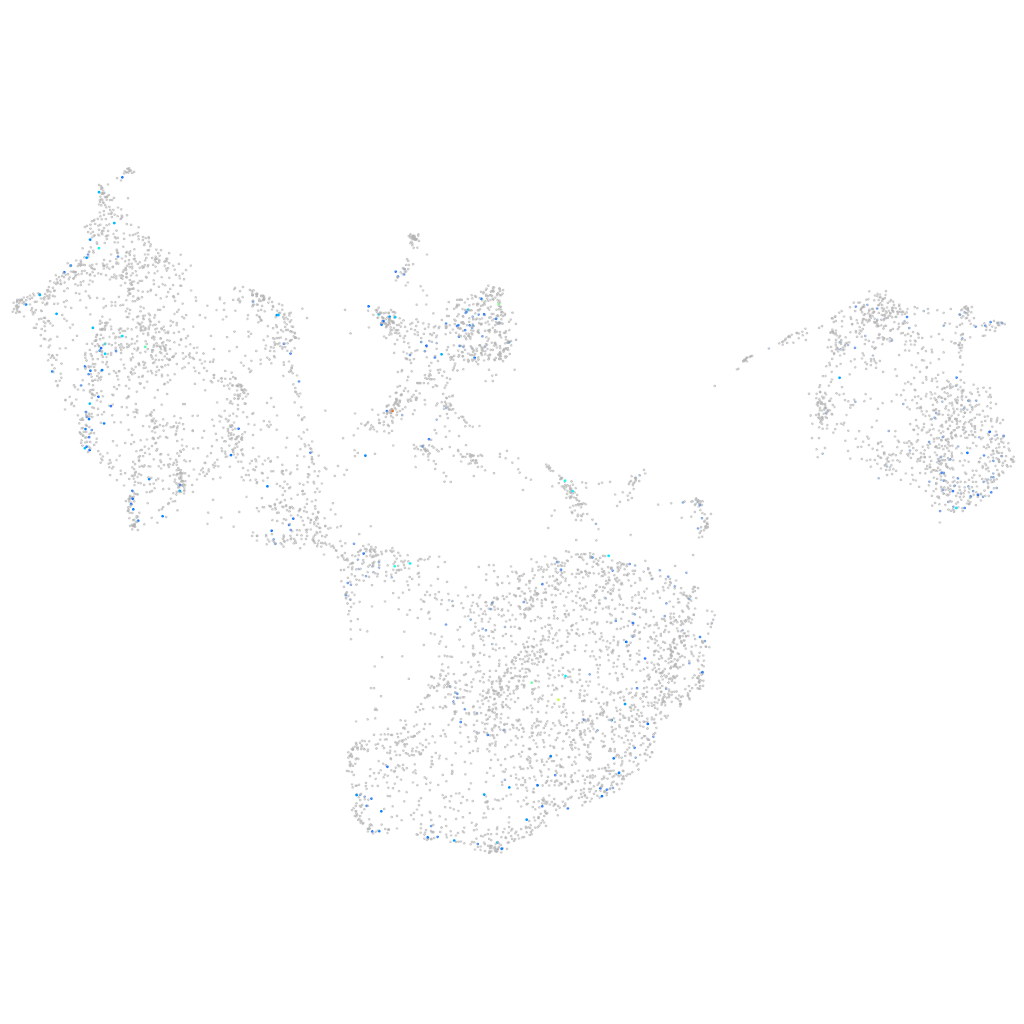
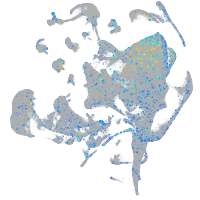
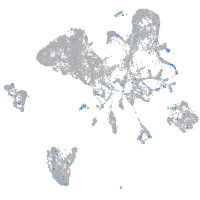
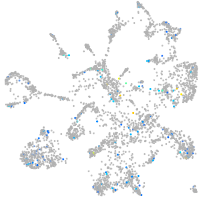
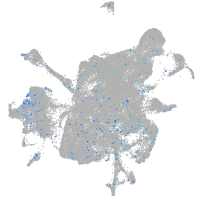
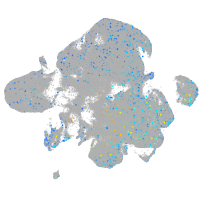
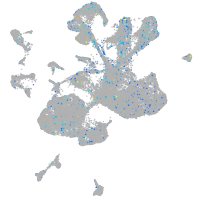
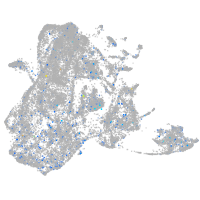
Gene expression UMAP
Display:
Expression
Stage
Other cell groups
all cells
blastomeres
PGCs
endoderm
axial mesoderm
muscle
mural cells /
non-skeletal muscle
mesenchyme
hematopoietic /
vasculature
pronephros
neural
spinal cord / glia
eye
taste / olfactory
otic / lateral line
epidermis
periderm
fin
ionocytes / mucous
pigment cells
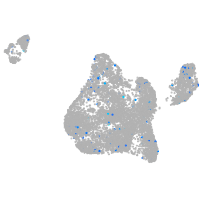
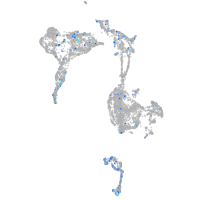
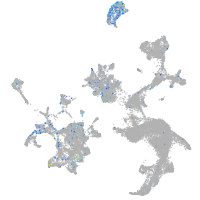
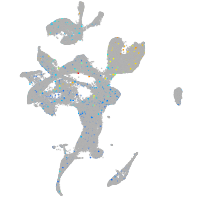
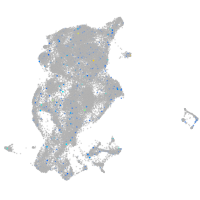
Expression by stage/cluster
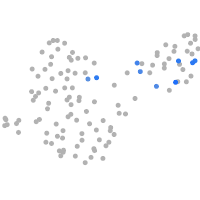
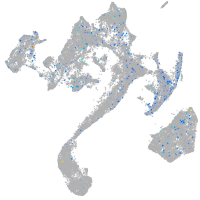
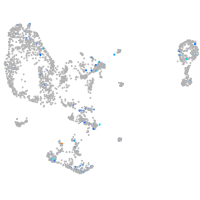
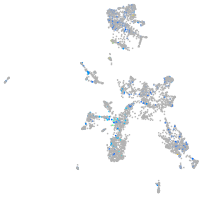
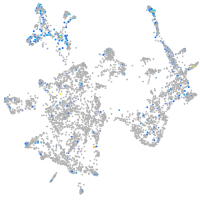
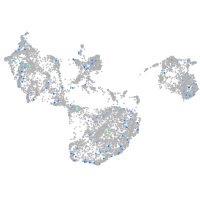
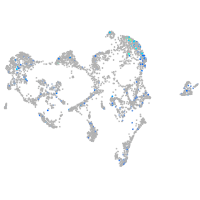
Correlated gene expression
Positive correlation
Negative correlation
Gene
r
Gene
r
tbx5b
0.189
si:dkey-151g10.6
-0.066
suv39h1a
0.174
rps9
-0.052
LOC101884295
0.172
rps29
-0.051
si:ch211-202m22.1
0.138
rpl38
-0.050
CU929365.1
0.136
rpl19
-0.048
SLCO3A1 (1 of many)
0.135
rpl34
-0.045
il1rapl2
0.135
zgc:114188
-0.043
CABZ01000634.1
0.132
rpl36a
-0.042
or103-5
0.131
rpl31
-0.042
si:ch73-256j6.2
0.116
rps24
-0.042
si:dkeyp-80d11.1
0.114
rps27.1
-0.042
LOC570405.1
0.112
rpl37
-0.041
her5
0.111
si:dkey-16p21.8
-0.040
si:ch73-193i2.2
0.109
rps12
-0.039
itm2cb
0.109
rpl35a
-0.039
cga
0.108
rps26l
-0.039
syngap1b
0.108
rplp1
-0.039
lhcgr
0.107
rps15a
-0.038
nr6a1b
0.103
rpl17
-0.037
XLOC-012410
0.102
rplp2l
-0.034
XLOC-018000
0.101
ahcy
-0.034
asb15a
0.100
rbp4
-0.034
SLC29A4 (1 of many)
0.098
ccl25b
-0.034
CABZ01075114.1
0.097
rpl28
-0.034
LOC108183595
0.097
rpl23
-0.034
si:ch211-274f20.2
0.097
krt5
-0.034
tespa1
0.095
rpl39
-0.034
LOC110439328
0.095
cyt1
-0.033
abcb11a
0.095
rps28
-0.033
si:ch73-160p18.4
0.094
rpl35
-0.033
pip4k2ab
0.092
rps4x
-0.032
nobox
0.090
mrto4
-0.032
LOC103911063
0.089
ecrg4b
-0.032
BX649295.2
0.088
nop10
-0.032
si:ch211-203b8.6
0.088
krtt1c19e
-0.032