Daniocell
si:ch211-226m16.2 (pigment cells)
si:ch211-226m16.2
ZFIN
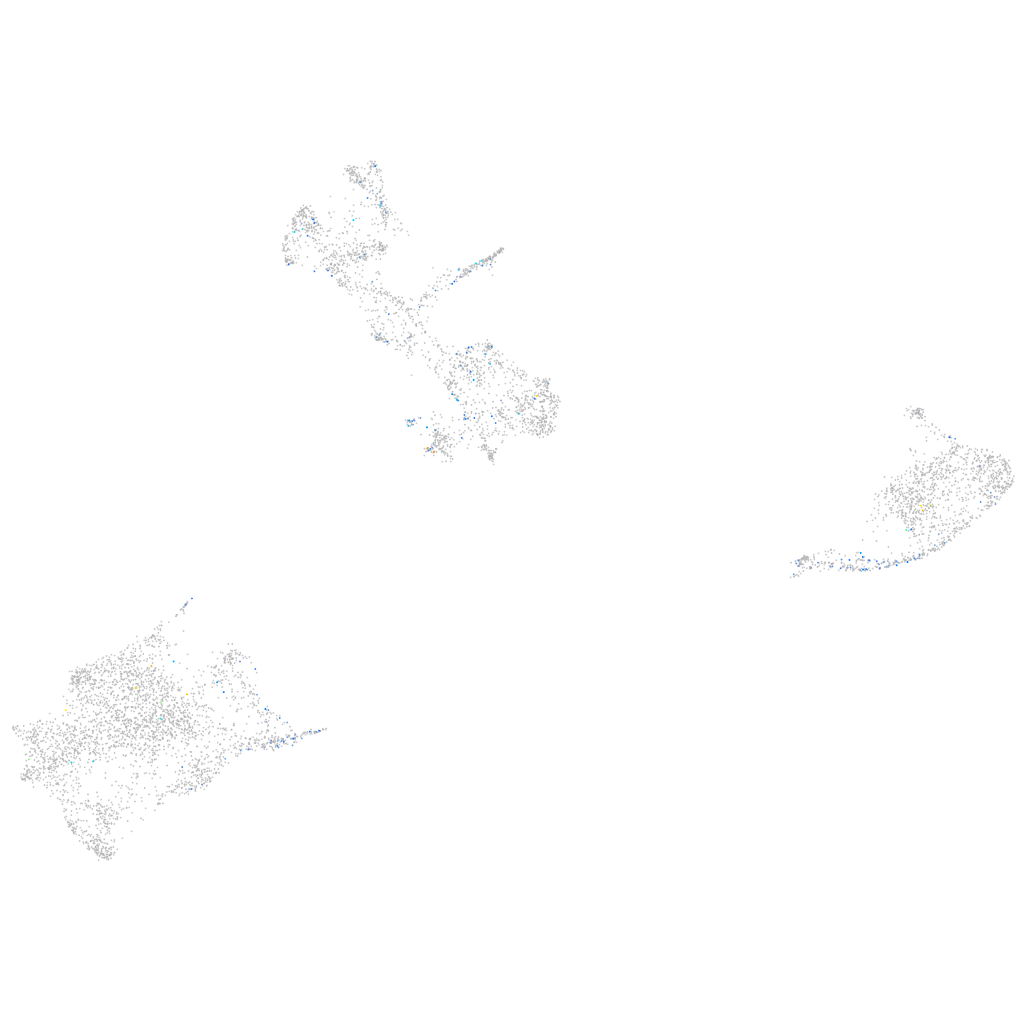
Gene expression UMAP
Display:
Expression
Stage
Other cell groups
all cells
blastomeres
PGCs
endoderm
axial mesoderm
muscle
mural cells /
non-skeletal muscle
mesenchyme
hematopoietic /
vasculature
pronephros
neural
spinal cord / glia
eye
taste / olfactory
otic / lateral line
epidermis
periderm
fin
ionocytes / mucous
pigment cells
Expression by stage/cluster
Correlated gene expression
Positive correlation
Negative correlation
Gene
r
Gene
r
XLOC-031547
0.190
gstp1
-0.068
XLOC-034430
0.187
slc22a7a
-0.066
CABZ01111959.1
0.169
si:dkey-251i10.2
-0.063
LOC558761
0.168
CABZ01021592.1
-0.063
CR356246.1
0.158
uraha
-0.063
cdh27
0.144
si:ch211-251b21.1
-0.054
oatx
0.137
zgc:110339
-0.052
nek3
0.133
pvalb1
-0.048
CABZ01075628.1
0.128
mdh1aa
-0.048
LOC110437725
0.127
aqp3a
-0.042
znf1101
0.120
tmem130
-0.041
atp1b2b
0.119
pon1
-0.041
LO018508.1
0.118
rtn1b
-0.040
podxl
0.116
myhz1.1
-0.039
rgl3b
0.114
prdx5
-0.038
elovl4b
0.114
pmp22b
-0.038
AL929217.1
0.113
actc1b
-0.038
cga
0.112
csrp2
-0.037
opn6a
0.111
bscl2l
-0.037
fbxo32
0.111
asip2b
-0.037
BNC1
0.110
gch2
-0.034
si:ch1073-406l10.2
0.110
plin6
-0.033
crb2a
0.110
oxr1b
-0.033
LOC103912045
0.108
glud1a
-0.033
gpr35.1
0.107
icn
-0.033
notum1b
0.106
si:ch73-366l1.5
-0.033
fbn2a.1
0.105
hbbe1.3
-0.032
gal3st1b
0.103
TMEM19
-0.032
LOC101884052
0.103
si:zfos-1069f5.1
-0.032
LOC101886923
0.101
nupr1a
-0.032
h2af1al
0.099
aldh1l1
-0.031
si:ch211-251f6.6
0.099
bco1
-0.031
mmp11a
0.098
marcksl1b
-0.031
CABZ01066725.1
0.098
mylpfa
-0.030
cbln11
0.098
tnni2a.4
-0.030