Daniocell
si:ch211-209j10.6 (fin)
si:ch211-209j10.6
ZFIN
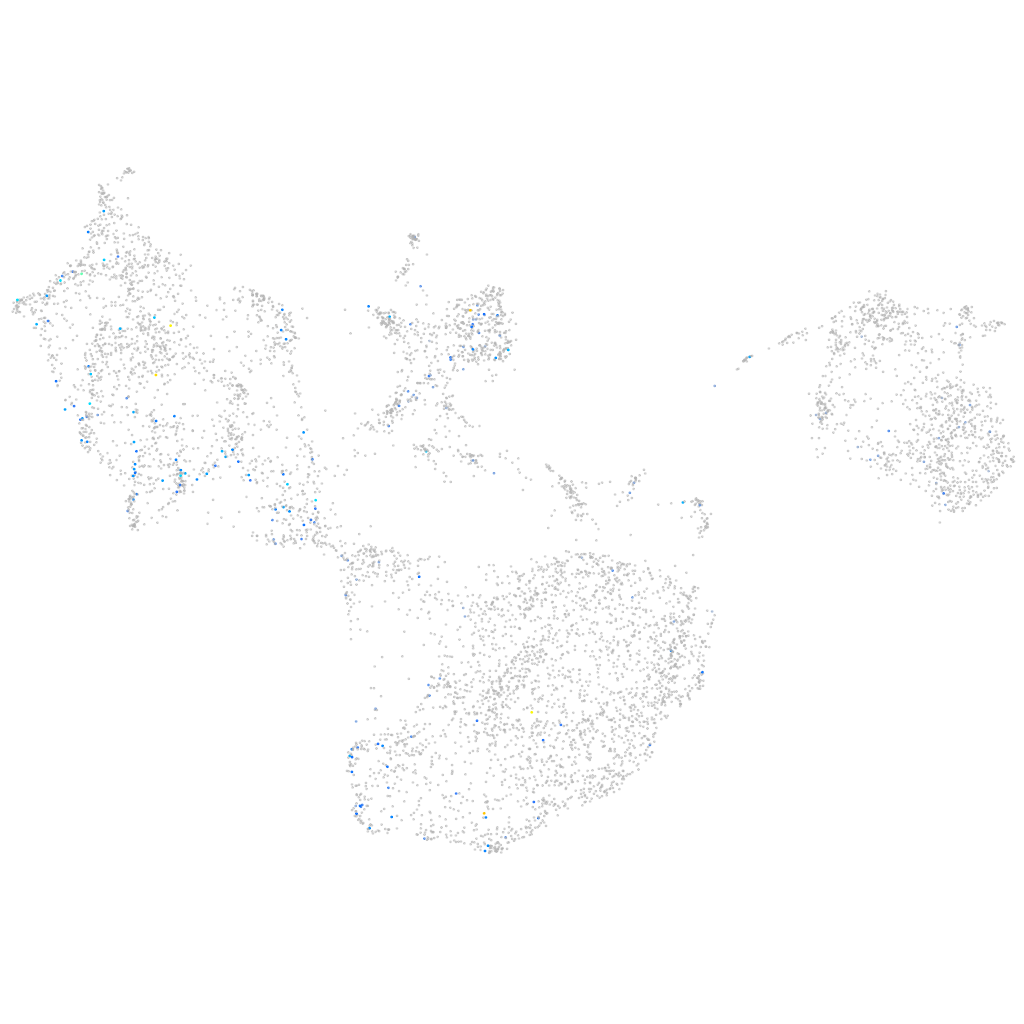
Gene expression UMAP
Display:
Expression
Stage
Other cell groups
all cells
blastomeres
PGCs
endoderm
axial mesoderm
muscle
mural cells /
non-skeletal muscle
mesenchyme
hematopoietic /
vasculature
pronephros
neural
spinal cord / glia
eye
taste / olfactory
otic / lateral line
epidermis
periderm
fin
ionocytes / mucous
pigment cells
Expression by stage/cluster
Correlated gene expression
Positive correlation
Negative correlation
Gene
r
Gene
r
si:ch211-27e6.1
0.200
krt4
-0.094
LOC110438087
0.165
anxa1a
-0.093
LOC108182776
0.140
rbp4
-0.091
dip2bb
0.139
cyt1
-0.089
MYL2
0.135
krt5
-0.088
pde6a
0.135
si:dkey-33c14.3
-0.085
LOC110440052
0.133
tmsb1
-0.082
XLOC-007706
0.130
wu:fb18f06
-0.081
LOC103911920
0.130
pycard
-0.080
stx1a
0.128
ecrg4b
-0.079
si:dkey-21c1.4
0.125
cfl1l
-0.079
si:dkeyp-61b2.1
0.123
si:dkey-102c8.3
-0.077
LOC101883824
0.123
cotl1
-0.077
si:dkey-238o14.1
0.123
epcam
-0.074
pcdhb
0.122
pfn1
-0.074
XLOC-002710
0.122
hbegfa
-0.074
XLOC-033352
0.119
cldn1
-0.073
si:ch211-261d9.1
0.117
epgn
-0.073
p2rx2
0.116
anxa2a
-0.072
LO018629.1
0.110
itgb1b.1
-0.072
FRMD4A
0.110
wu:fa03e10
-0.071
fam184a
0.109
arhgef5
-0.071
XLOC-009919
0.108
tmsb4x
-0.071
slc38a11
0.106
s100a10b
-0.070
gpr158a
0.105
ahnak
-0.069
CT955967.1
0.104
cxl34b.11
-0.069
selenom
0.104
fmodb
-0.069
LOC101883008
0.102
myh9a
-0.069
sema6ba
0.102
cyt1l
-0.069
tmeff1b
0.102
itgb3a
-0.068
lmo2
0.101
cldni
-0.068
ndst3
0.101
si:rp71-77l1.1
-0.068
LOC110438242
0.100
itgb4
-0.067
XLOC-044297
0.100
zgc:86896
-0.066
calr
0.100
krtt1c19e
-0.066