Daniocell
si:ch211-199o1.2 (axial mesoderm)
si:ch211-199o1.2 [Source:ZFIN;Acc:ZDB-GENE-060503-867]
ZFIN
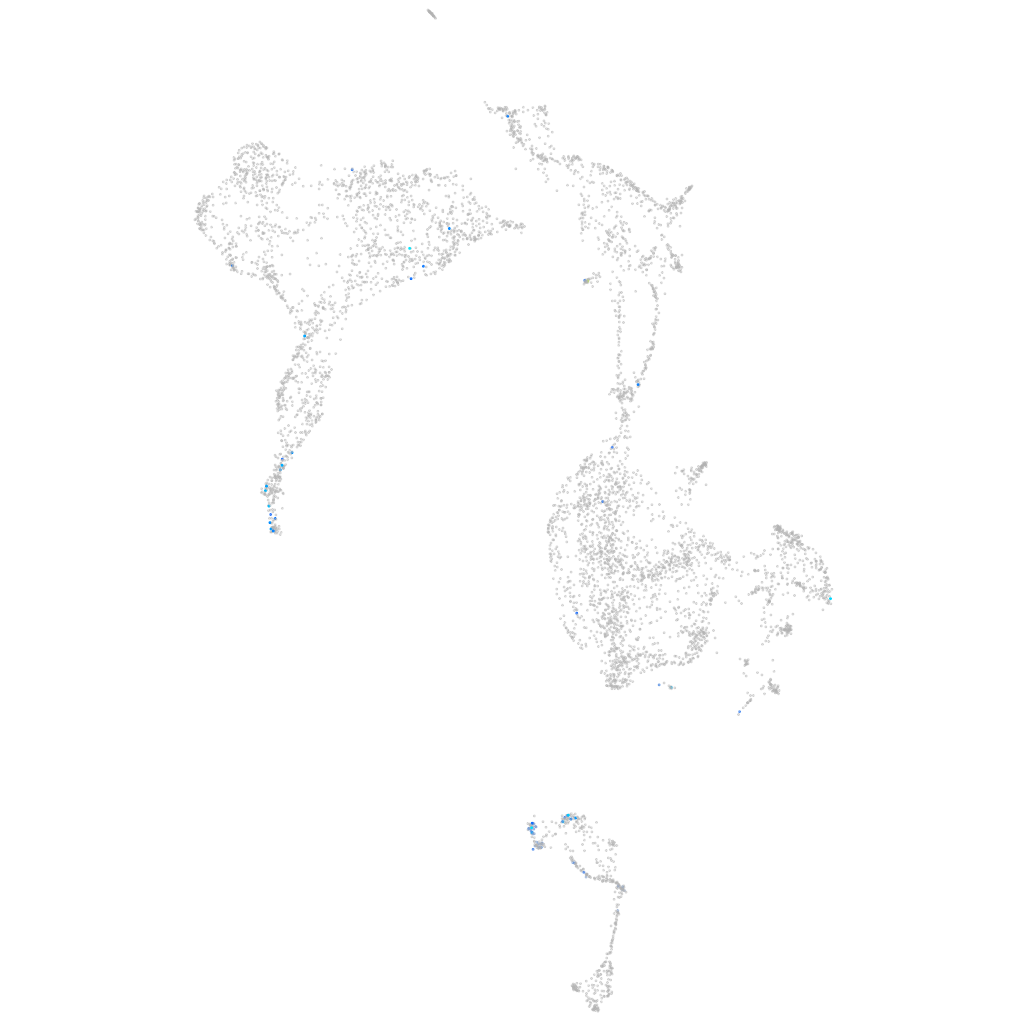
Gene expression UMAP
Display:
Expression
Stage
Other cell groups
all cells
blastomeres
PGCs
endoderm
axial mesoderm
muscle
mural cells /
non-skeletal muscle
mesenchyme
hematopoietic /
vasculature
pronephros
neural
spinal cord / glia
eye
taste / olfactory
otic / lateral line
epidermis
periderm
fin
ionocytes / mucous
pigment cells
Expression by stage/cluster
Correlated gene expression
Positive correlation
Negative correlation
Gene
r
Gene
r
asb15b
0.303
col11a1a
-0.076
LOC110438396
0.303
col2a1a
-0.075
LOC110438548
0.275
qkia
-0.073
FO907089.1
0.243
sept15
-0.071
LOC101885806
0.231
col9a1b
-0.071
BX323444.2
0.219
col9a3
-0.071
LOC100331497
0.210
cnmd
-0.071
BX908753.1
0.198
zmp:0000000760
-0.069
timp4.1
0.196
col8a1a
-0.069
zgc:194330
0.183
col9a2
-0.066
BX901962.1
0.180
tbxta
-0.066
BX088525.2
0.178
si:ch73-23l24.1
-0.065
si:dkey-239j18.2
0.167
cmn
-0.065
ftr59
0.166
serpinh1b
-0.063
samd7
0.165
tmsb4x
-0.063
tspan13b
0.165
zgc:113232
-0.062
bhlha15
0.162
haus7
-0.061
quo
0.162
sparc
-0.061
LOC108179246
0.162
col11a2
-0.060
BX901898.1
0.161
epyc
-0.060
zgc:174153
0.160
shha
-0.059
slc31a2
0.160
spry2
-0.057
CABZ01068177.1
0.158
dynll1
-0.056
isl1
0.156
actb2
-0.056
wnt8b
0.155
ucmab
-0.055
creld2
0.155
loxl1
-0.055
gpr160
0.153
golim4b
-0.054
si:ch1073-469d17.2
0.152
ntd5
-0.054
ahcyl1
0.151
fkbp14
-0.053
ctslb
0.151
tpm4a
-0.053
coa7
0.151
serf2
-0.052
xkr9
0.151
msna
-0.052
si:ch73-122g19.1
0.150
phgdh
-0.052
gabrr2b
0.148
cd81a
-0.052
si:dkey-269i1.4
0.147
col2a1b
-0.051