Daniocell
si:ch211-193i15.2 (mesenchyme)
si:ch211-193i15.2 [Source:ZFIN;Acc:ZDB-GENE-141216-17]
ZFIN
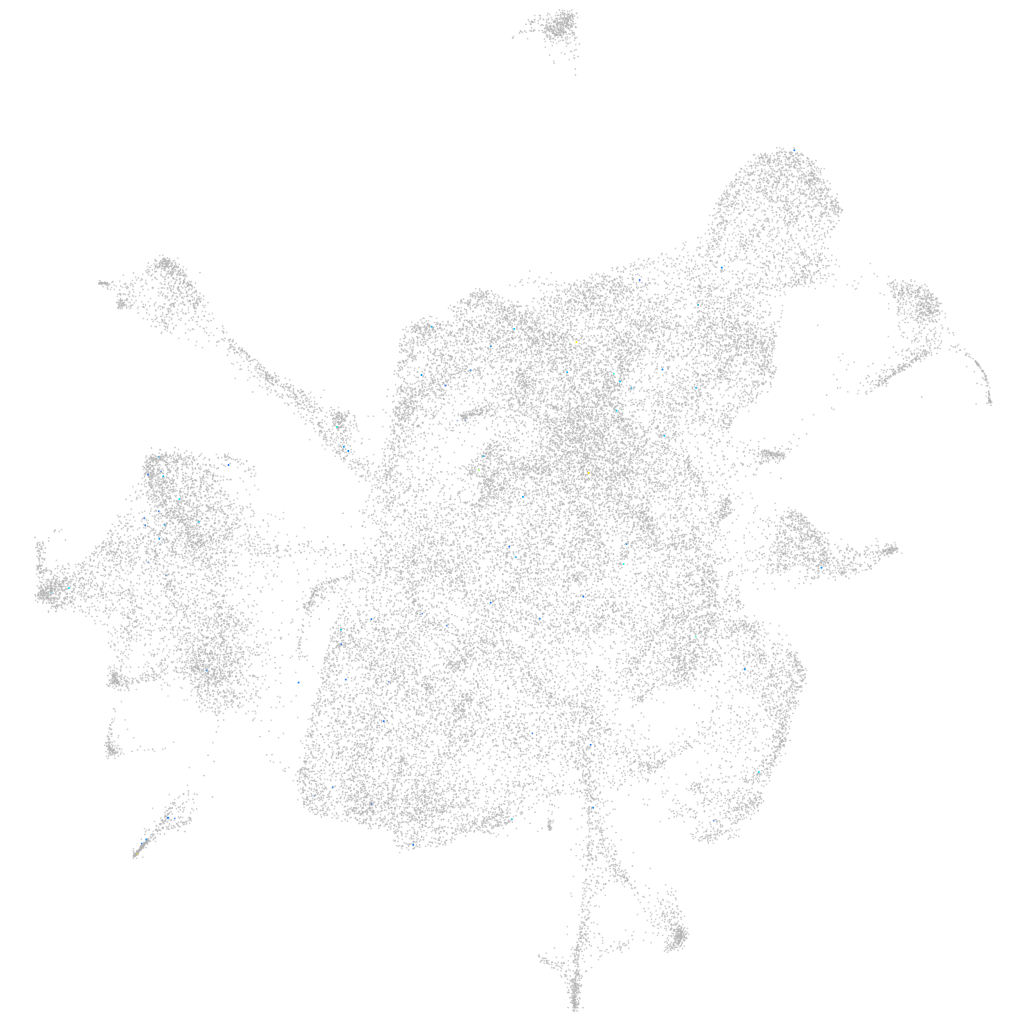
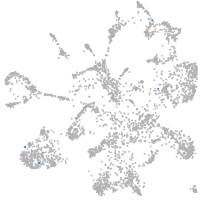
Gene expression UMAP
Display:
Expression
Stage
Other cell groups
all cells
blastomeres
PGCs
endoderm
axial mesoderm
muscle
mural cells /
non-skeletal muscle
mesenchyme
hematopoietic /
vasculature
pronephros
neural
spinal cord / glia
eye
taste / olfactory
otic / lateral line
epidermis
periderm
fin
ionocytes / mucous
pigment cells
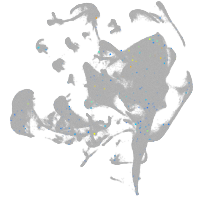
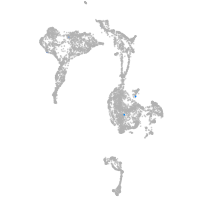
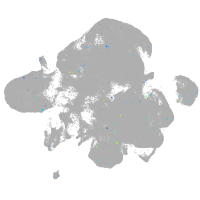
Expression by stage/cluster
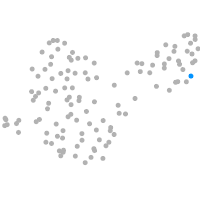
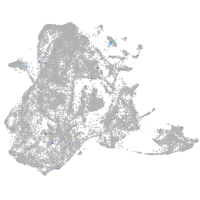
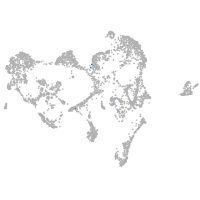
Correlated gene expression
Positive correlation
Negative correlation
Gene
r
Gene
r
FP016247.1
0.191
rpl39
-0.017
LOC110439612
0.153
si:dkey-151g10.6
-0.016
znf976
0.143
cct3
-0.012
BX571884.1
0.124
prss59.2
-0.012
or127-1
0.115
mrps18c
-0.012
zmp:0000001006
0.113
rpl38
-0.012
or119-2
0.098
ost4
-0.012
chrna7
0.096
ndufv2
-0.011
LOC110438283
0.077
apoa1b
-0.011
FO393424.2
0.076
znf593
-0.011
XLOC-039747
0.074
rps29
-0.011
XLOC-040575
0.071
timm8b
-0.011
LOC101882990
0.069
MCMDC2
-0.010
si:dkey-254e13.6
0.065
rplp2l
-0.010
BX649533.1
0.064
si:dkey-264d12.4
-0.010
LOC108179130
0.062
sub1a
-0.010
XLOC-026153
0.061
abt1
-0.010
LOC103909114
0.061
tnn
-0.010
si:dkey-16i5.8
0.057
zgc:175088
-0.010
BX664721.3
0.053
rps19bp1
-0.010
zp3b
0.052
ism1
-0.010
cidea
0.051
htatsf1
-0.010
si:ch211-152f2.2
0.051
tnnt3b
-0.010
pimr85
0.050
rps26l
-0.010
si:dkey-47k20.5
0.048
kazald3
-0.010
rabgap1l2
0.048
pabpc1a
-0.009
adgre10
0.048
slc7a1
-0.009
inha
0.048
si:ch211-276c2.4
-0.009
LOC103910690
0.047
eif2b1
-0.009
CR749774.1
0.046
rwdd1
-0.009
bsnd
0.046
ttc36
-0.009
XLOC-040068
0.045
pgm1
-0.009
SPATA1
0.044
gpx4a
-0.009
tnfrsf18
0.044
pfdn6
-0.009
si:dkey-22i16.9
0.044
fam210b
-0.009