Daniocell
si:ch1073-406l10.2 (pronephros)
si:ch1073-406l10.2
ZFIN
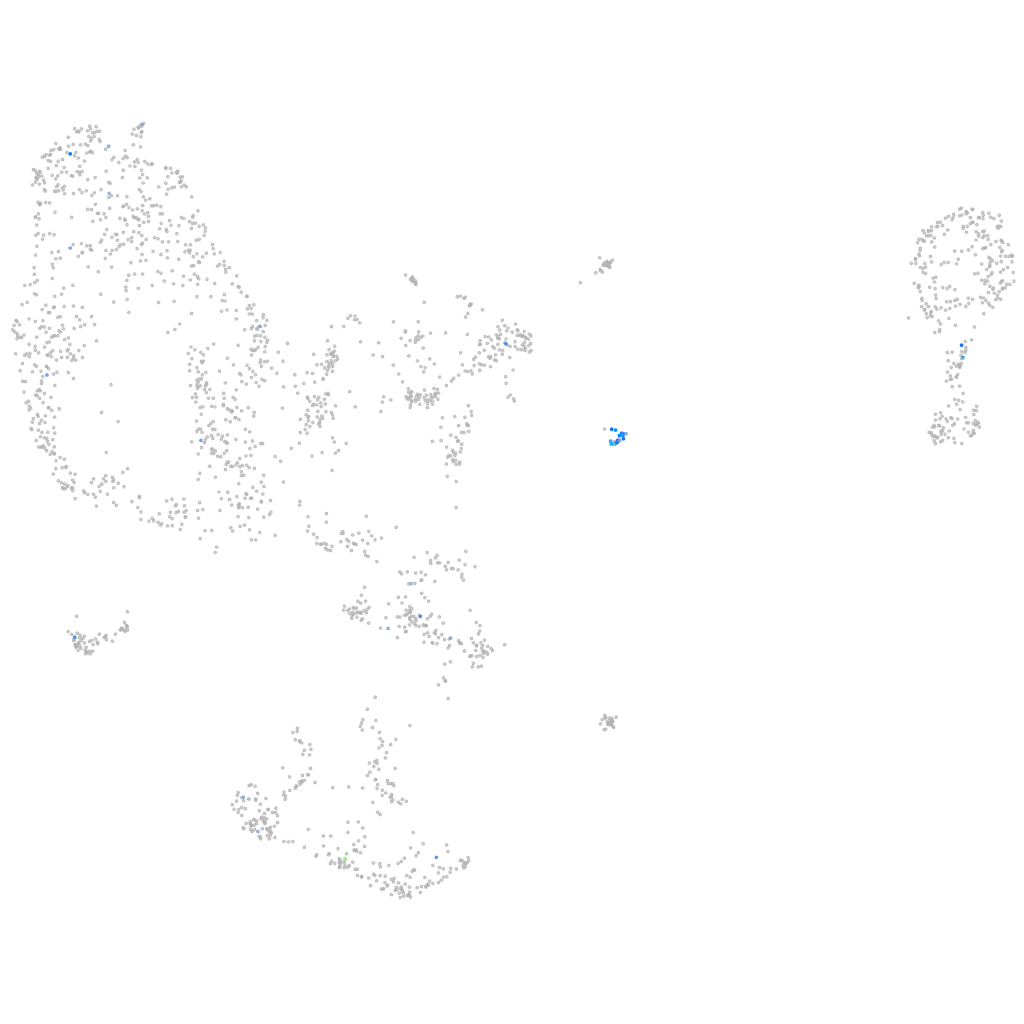
Gene expression UMAP
Display:
Expression
Stage
Other cell groups
all cells
blastomeres
PGCs
endoderm
axial mesoderm
muscle
mural cells /
non-skeletal muscle
mesenchyme
hematopoietic /
vasculature
pronephros
neural
spinal cord / glia
eye
taste / olfactory
otic / lateral line
epidermis
periderm
fin
ionocytes / mucous
pigment cells
Expression by stage/cluster
Correlated gene expression
Positive correlation
Negative correlation
Gene
r
Gene
r
capn12
0.523
hsp90ab1
-0.079
si:dkey-102c8.3
0.510
cfl1
-0.077
lamb4
0.496
sub1a
-0.057
mocs2
0.487
zgc:110425
-0.057
cldn1
0.483
ezra
-0.052
si:ch211-256a21.4
0.468
nucks1a
-0.052
cldni
0.463
nucks1b
-0.052
fmodb
0.459
dpy30
-0.050
epgn
0.422
slc26a6
-0.049
olfm2b
0.417
si:ch211-222l21.1
-0.049
LOC108192008
0.407
hmgn2
-0.049
si:dkey-33c14.3
0.406
sh3bp5b
-0.049
itgb3a
0.403
npr1b
-0.048
tp63
0.401
LOC101883320
-0.048
abi3b
0.399
h3f3d
-0.048
gpr31
0.396
si:rp71-17i16.6
-0.047
fat2
0.396
hmgb2b
-0.047
spaca4l
0.394
akap12b
-0.046
itga2.2
0.391
acy3.2
-0.046
col14a1b
0.388
si:ch211-288g17.3
-0.046
zgc:101810
0.387
si:dkey-28n18.9
-0.045
cxl34b.11
0.384
slc4a4a
-0.045
rab42b
0.380
rpl13
-0.045
zgc:86896
0.375
zgc:56095
-0.045
hhipl2
0.374
dab2
-0.045
krt91
0.372
selenof
-0.045
aqp3a
0.367
add3a
-0.044
si:ch73-173h19.3
0.365
pgrmc1
-0.044
col28a2b
0.365
aqp8b
-0.044
si:ch211-210b2.3
0.364
mrpl40
-0.044
snap23.2
0.357
fam57a
-0.043
ecrg4b
0.355
slc4a2a
-0.043
si:rp71-77l1.1
0.353
chrac1
-0.043
zbtb47b
0.351
hmgb3a
-0.043
cxcl18a.1
0.348
hnrnph1l
-0.042