Daniocell
shprh (eye)
SNF2 histone linker PHD RING helicase
ZFIN
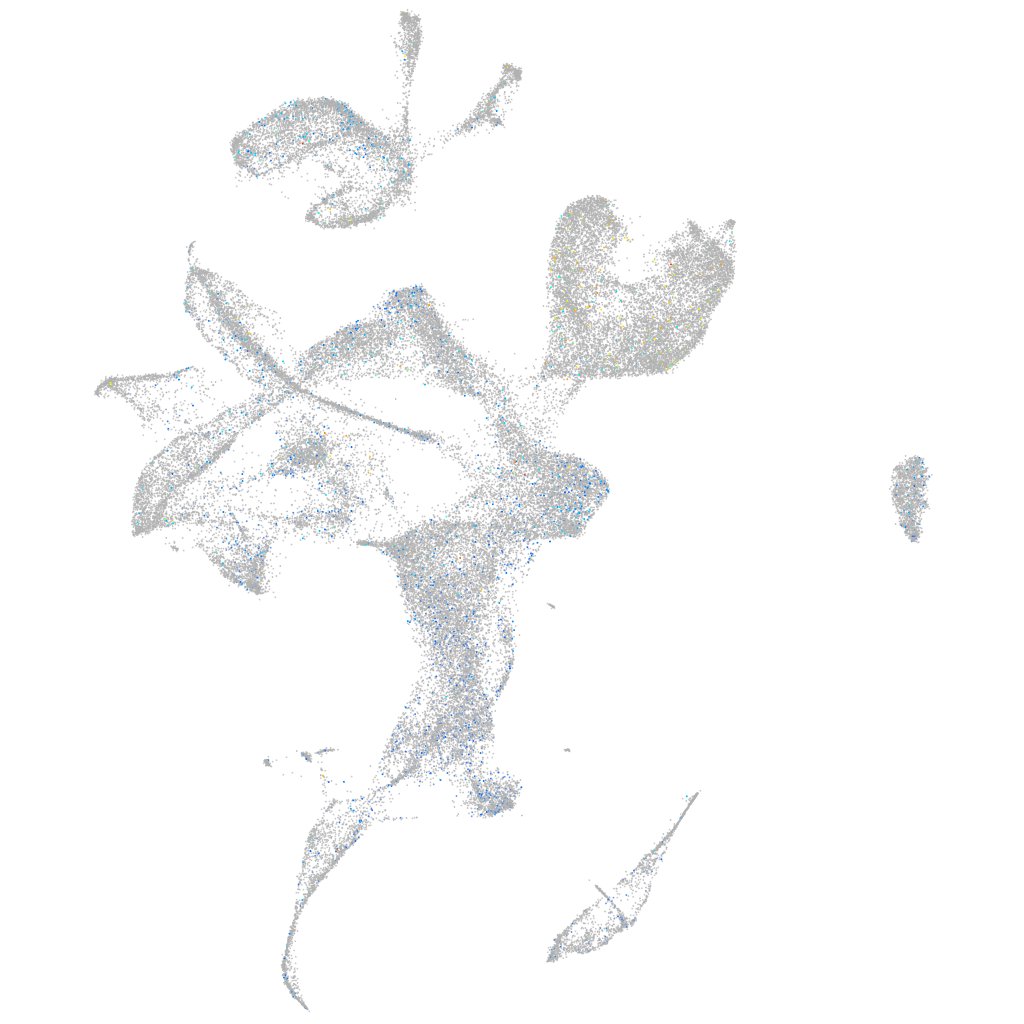
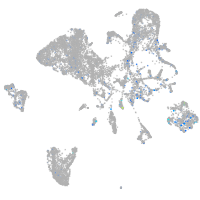
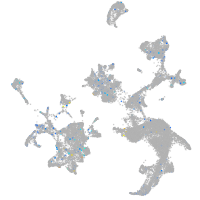
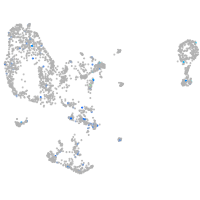
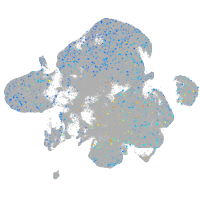
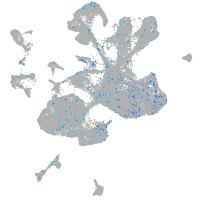
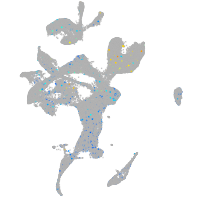
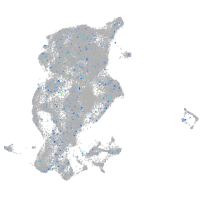
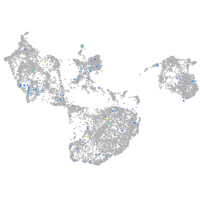
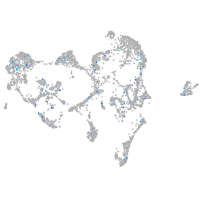
Gene expression UMAP
Display:
Expression
Stage
Other cell groups
all cells
blastomeres
PGCs
endoderm
axial mesoderm
muscle
mural cells /
non-skeletal muscle
mesenchyme
hematopoietic /
vasculature
pronephros
neural
spinal cord / glia
eye
taste / olfactory
otic / lateral line
epidermis
periderm
fin
ionocytes / mucous
pigment cells
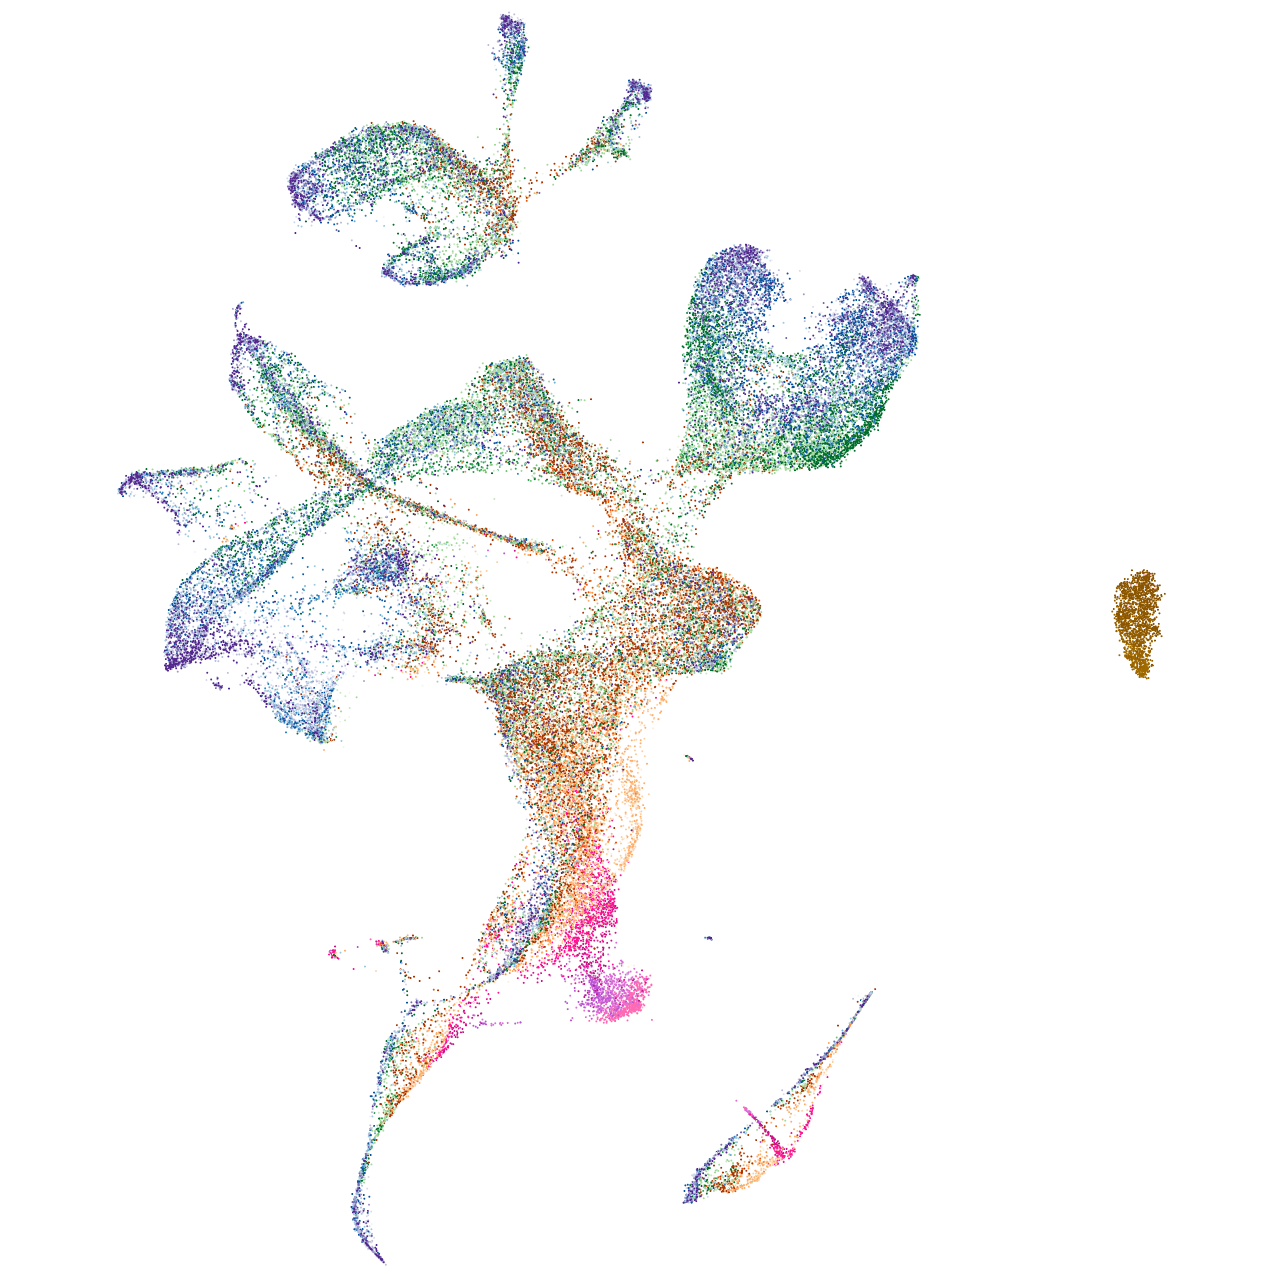
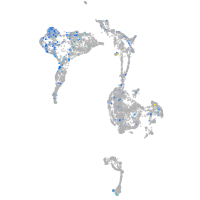
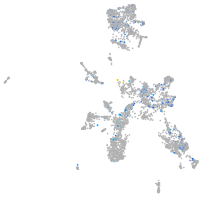
Expression by stage/cluster
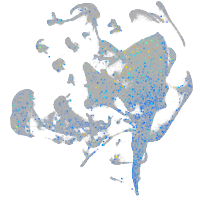
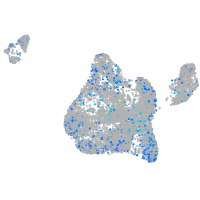
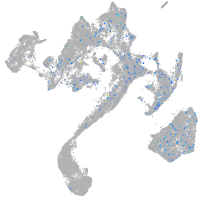
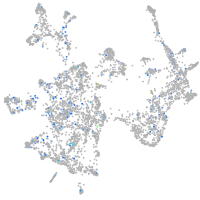
Correlated gene expression
Positive correlation
Negative correlation
Gene
r
Gene
r
LOC108180313
0.066
pvalb2
-0.019
b4galnt3a
0.044
syt5a
-0.018
BX469930.2
0.043
mylpfa
-0.018
si:dkey-88n24.9
0.042
pvalb9
-0.018
CR812896.1
0.042
tpma
-0.017
LOC110438357
0.040
atp1a3b
-0.017
LOC101884463
0.039
gapdhs
-0.017
BX004873.1
0.039
ckmt2b
-0.016
FP009765.1
0.038
si:ch211-285j22.3
-0.016
si:ch211-218m3.13
0.038
ttn.1
-0.016
XLOC-000357
0.037
slc25a3a
-0.016
hhla2b.1
0.037
prph2a
-0.016
si:ch211-232d10.3
0.037
tulp1b
-0.016
LOC100334716
0.036
gnb3b
-0.015
RF00319
0.036
gapdh
-0.015
lck
0.036
guca1c
-0.015
si:ch211-132e22.4
0.034
si:dkey-16p21.8
-0.015
CABZ01078080.1
0.034
rbp3
-0.015
marcksb
0.034
myhz1.1
-0.015
LOC108191611
0.033
tob1a
-0.015
LOC103909787
0.033
apoa1b
-0.015
LOC110438349
0.033
apoa2
-0.015
hnrnpaba
0.033
ckbb
-0.015
LOC108182168
0.033
actc1b
-0.015
spink2.2
0.033
nme2b.2
-0.014
chd7
0.032
gabarapl2
-0.014
kif11
0.032
gnat2
-0.014
aspm
0.032
nme2a
-0.014
rell2
0.031
tnni2a.4
-0.014
LOC562245
0.031
pvalb8
-0.014
si:ch211-237a4.2
0.031
gem
-0.014
si:ch211-222l21.1
0.030
si:ch211-81a5.8
-0.014
styk1a
0.030
calm1b
-0.014
CR376776.1
0.030
ap1m2
-0.014
LOC101886743
0.030
tcima
-0.013