Daniocell
sharpin (blastomeres)
SHANK-associated RH domain interacting protein
ZFIN
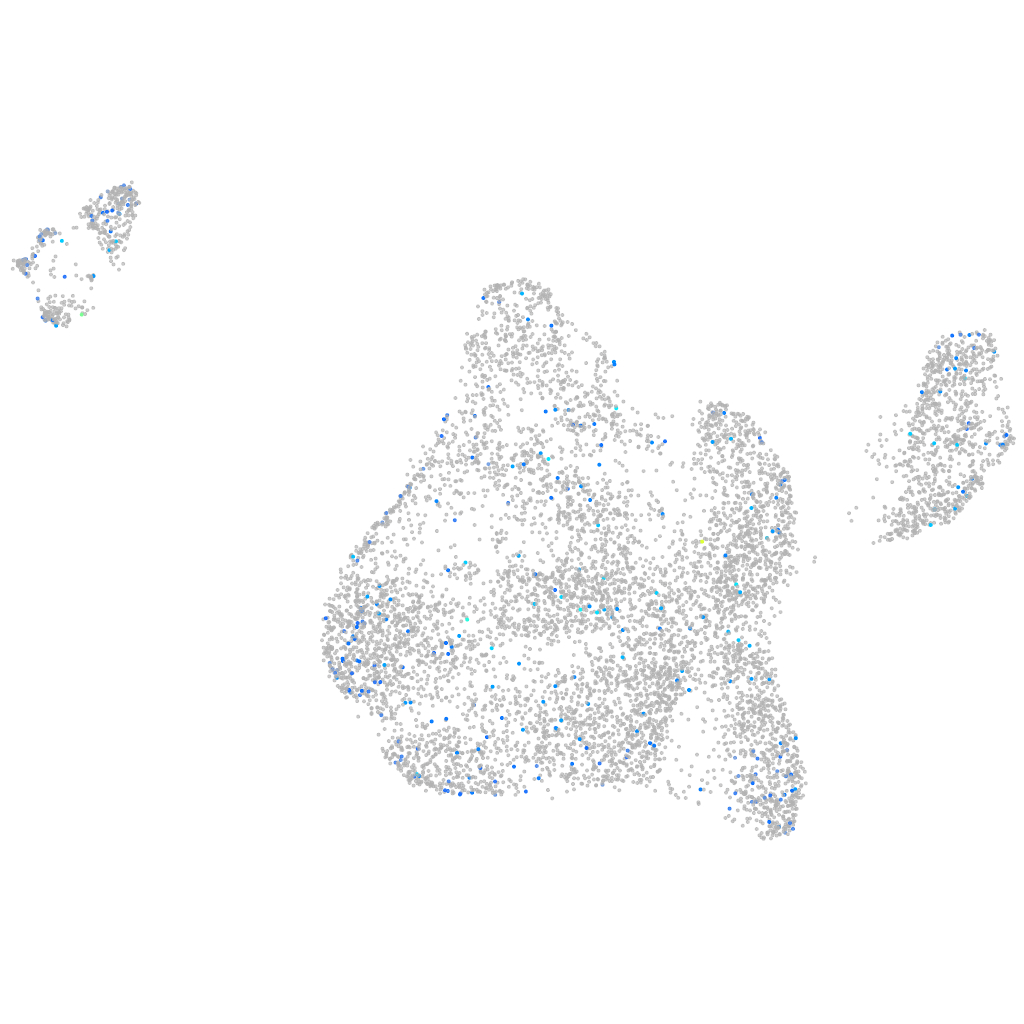
Gene expression UMAP
Display:
Expression
Stage
Other cell groups
all cells
blastomeres
PGCs
endoderm
axial mesoderm
muscle
mural cells /
non-skeletal muscle
mesenchyme
hematopoietic /
vasculature
pronephros
neural
spinal cord / glia
eye
taste / olfactory
otic / lateral line
epidermis
periderm
fin
ionocytes / mucous
pigment cells
Expression by stage/cluster
Correlated gene expression
Positive correlation
Negative correlation
Gene
r
Gene
r
si:dkey-202b22.5
0.135
ybx1
-0.042
si:dkeyp-72e1.7
0.126
hmgb2a
-0.039
BX322665.2
0.107
hmgn6
-0.038
FP102170.1
0.104
susd6
-0.037
vasna
0.092
mt-nd3
-0.036
hbbe1.1
0.084
rplp1
-0.035
mmp16b
0.084
NC-002333.4
-0.035
igsf5b
0.081
BX927258.1
-0.033
crygs2
0.081
hspb1
-0.032
CR388209.1
0.078
marcksl1b
-0.032
XLOC-042917
0.077
seta
-0.031
si:dkey-125e8.3
0.077
apoc1
-0.030
CABZ01061498.1
0.077
hmga1a
-0.030
cyp7b1
0.076
ncl
-0.030
adcy2a
0.076
si:ch211-222l21.1
-0.030
si:dkey-61p9.6
0.076
stm
-0.030
BX640453.1
0.076
mrps6
-0.030
pcdh7a
0.075
snrnp70
-0.029
anpepb
0.073
si:dkey-151g10.6
-0.028
zgc:194665
0.072
mgst1.1
-0.028
crybb3
0.070
zmiz2
-0.027
BX571664.1
0.069
CR383676.1
-0.027
LOC101886896
0.069
tuba8l4
-0.027
BX323854.2
0.068
si:ch211-166g5.4
-0.027
mir430a-4
0.068
pou5f3
-0.027
soul5
0.067
MZT1
-0.027
ppp1r3db
0.067
cox7b
-0.026
mtus1a
0.066
si:dkey-27i16.2
-0.026
si:ch73-359m17.7
0.066
mn1b
-0.026
mast1a
0.065
id3
-0.026
LOC101886091
0.065
LOC108190024
-0.026
epsti1
0.064
rps6
-0.026
si:ch73-170d6.3
0.064
hmgn2
-0.025
LOC108192140
0.064
si:ch73-281n10.2
-0.025
CR759887.1
0.063
eef1a1l1
-0.025