Daniocell
sh3pxd2b (ionocytes / mucous-producing)
SH3 and PX domains 2B
ZFIN
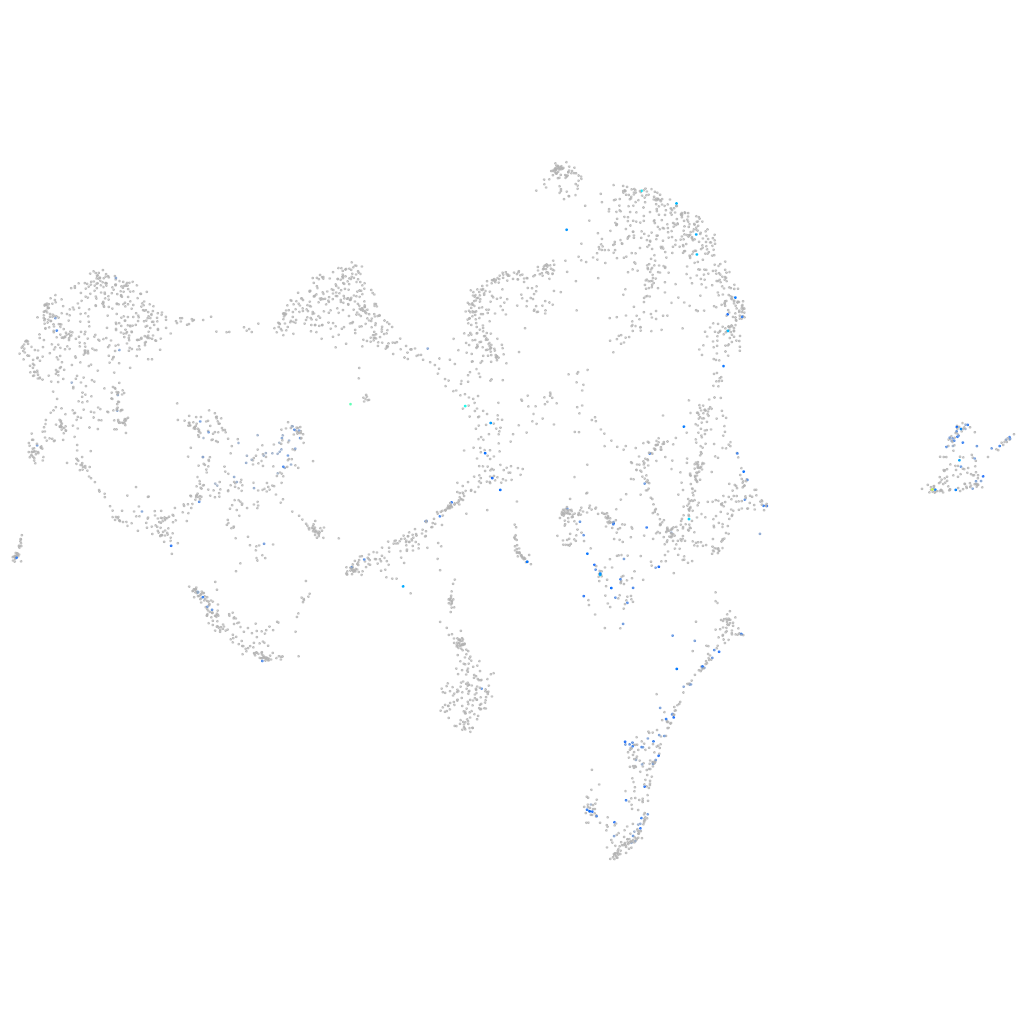
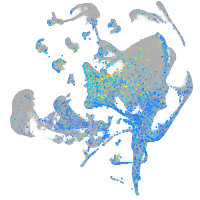
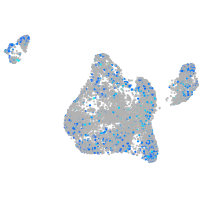
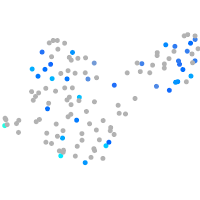
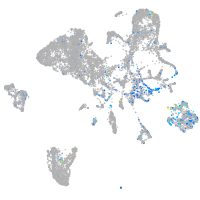
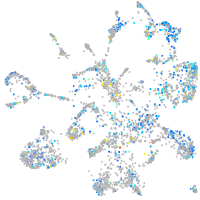
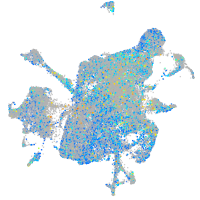
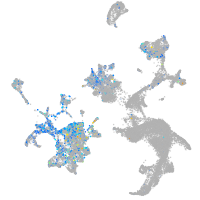
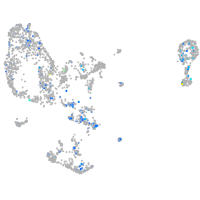
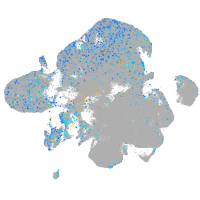
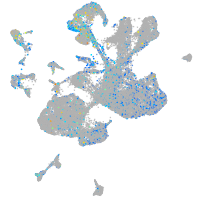
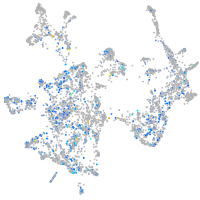
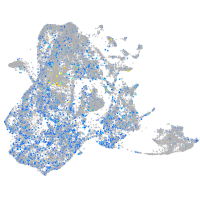
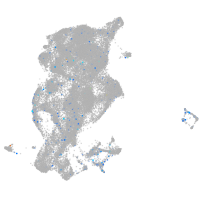
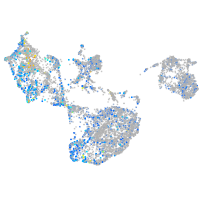
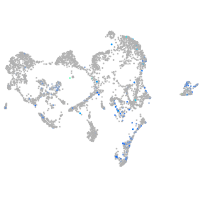
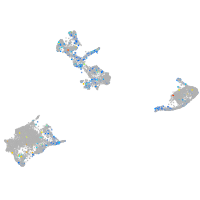
Gene expression UMAP
Display:
Expression
Stage
Other cell groups
all cells
blastomeres
PGCs
endoderm
axial mesoderm
muscle
mural cells /
non-skeletal muscle
mesenchyme
hematopoietic /
vasculature
pronephros
neural
spinal cord / glia
eye
taste / olfactory
otic / lateral line
epidermis
periderm
fin
ionocytes / mucous
pigment cells
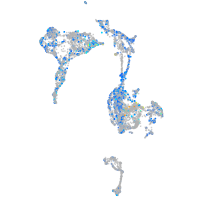
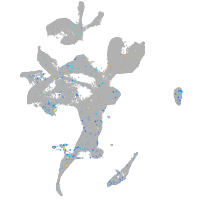
Expression by stage/cluster
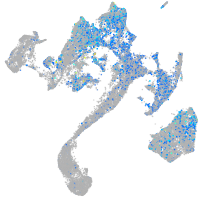
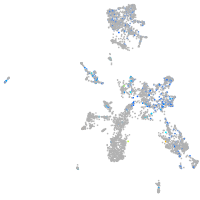
Correlated gene expression
Positive correlation
Negative correlation
Gene
r
Gene
r
LO018231.1
0.252
si:ch211-195b11.3
-0.111
gja5a
0.230
wu:fb18f06
-0.098
ecscr
0.223
icn2
-0.092
sez6b
0.220
atp1b1b
-0.092
pecam1
0.219
zgc:110333
-0.089
fam129ab
0.208
BX000438.2
-0.088
flt1
0.208
cldnh
-0.088
si:ch211-250c4.4
0.204
si:dkey-33i11.4
-0.087
LOC103909475
0.201
si:ch211-79k12.1
-0.084
zgc:158423
0.197
krt4
-0.084
bcam
0.194
si:dkey-247k7.2
-0.083
si:dkey-92j16.2
0.184
nqo1
-0.082
si:dkey-283b1.7
0.184
cldne
-0.082
cd151l
0.184
atp1a1a.2
-0.082
itga4
0.180
soul2
-0.081
rassf9
0.177
ndrg1a
-0.081
fstl1b
0.177
LOC799574
-0.079
bambib
0.176
selenow2b
-0.078
hyal2a
0.176
abcb5
-0.078
tpm4a
0.175
capn9
-0.077
cldni
0.174
zgc:153284
-0.077
si:ch211-191c10.1
0.173
si:dkey-193p11.2
-0.074
tp63
0.173
tmem45b
-0.074
XLOC-032976
0.171
spint2
-0.073
myct1b
0.171
agr1
-0.072
rbp7b
0.171
selenow1
-0.072
thsd1
0.171
rnf183
-0.071
rasip1
0.170
mt-nd3
-0.070
XLOC-039757
0.169
gbgt1l4
-0.070
smo
0.169
mgst1.2
-0.070
sparc
0.168
mpc1
-0.070
hspg2
0.166
si:dkey-184p9.7
-0.069
si:ch211-132b12.8
0.165
rgs5b
-0.068
prex2
0.165
epdl1
-0.067
lama5
0.164
mgll
-0.067