Daniocell
sh3glb2a (endoderm)
SH3-domain GRB2-like endophilin B2a
ZFIN
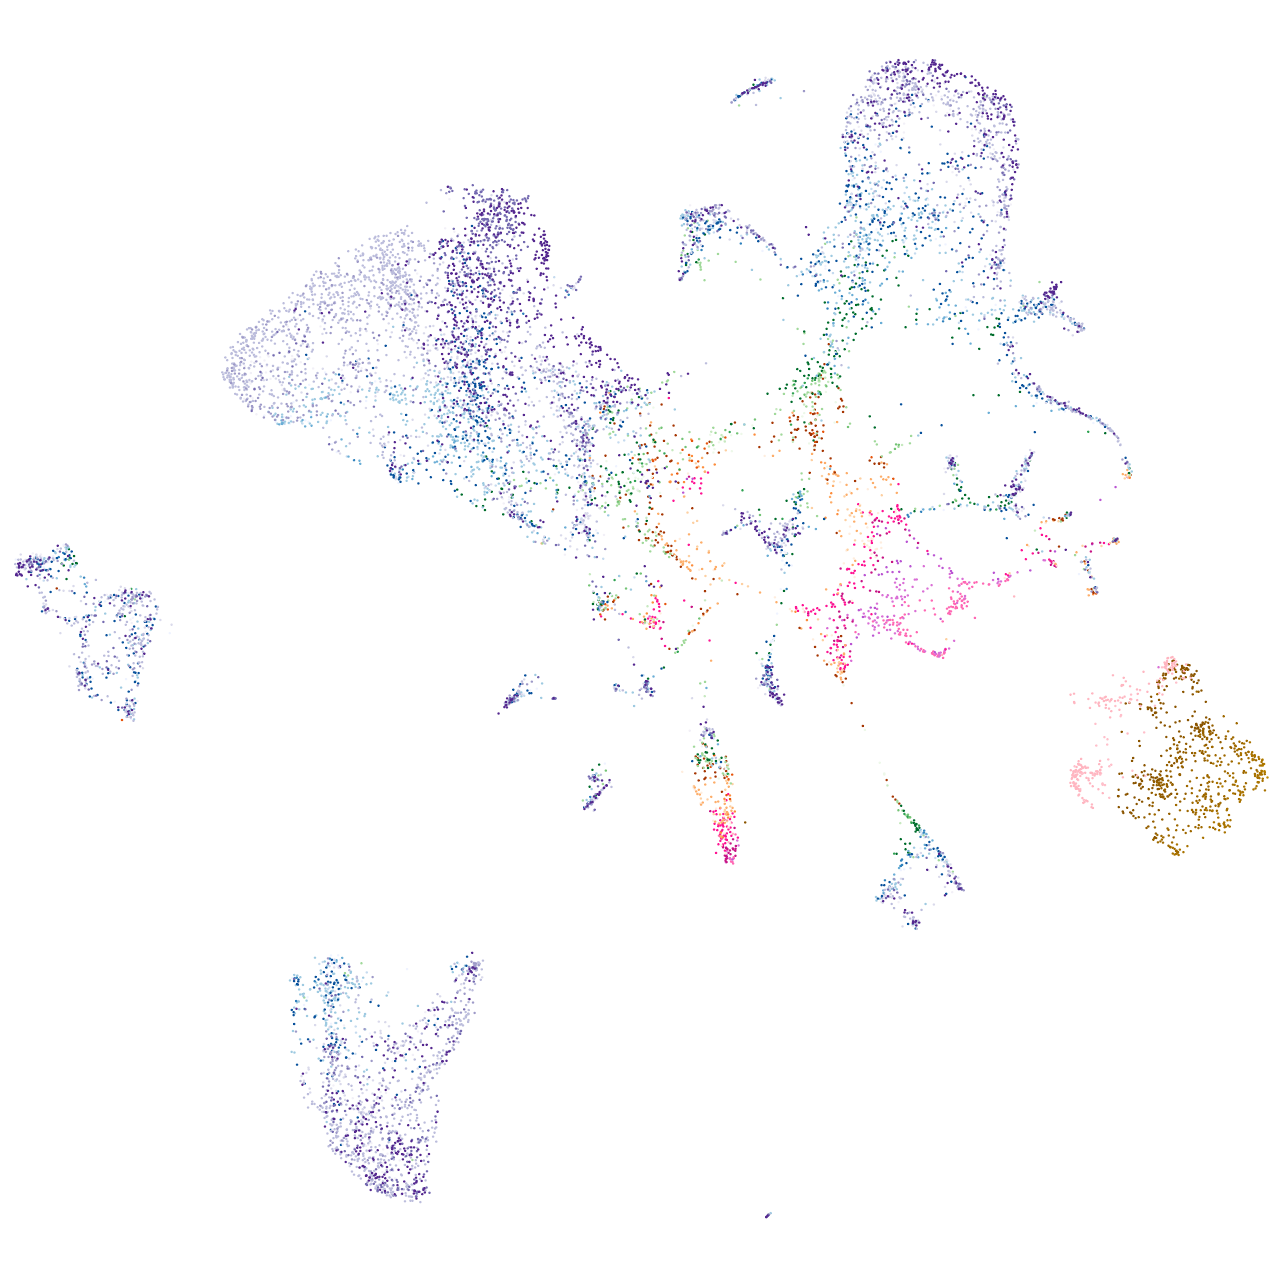
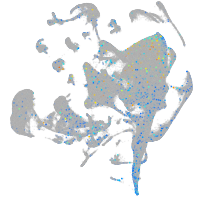
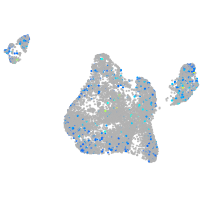
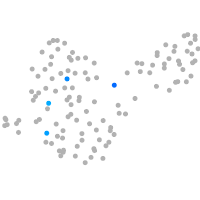
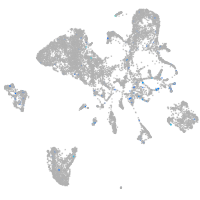
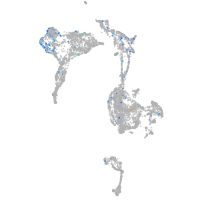
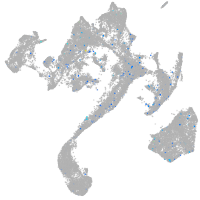
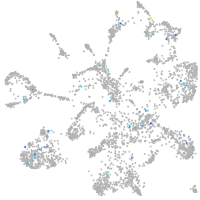
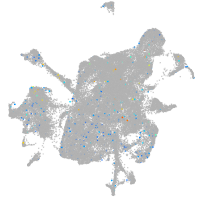
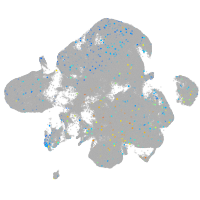
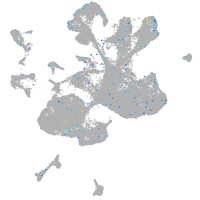
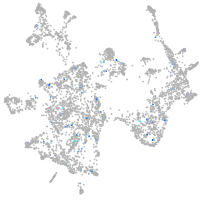
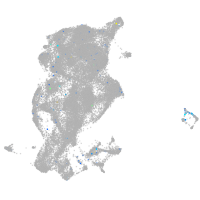
Gene expression UMAP
Display:
Expression
Stage
Other cell groups
all cells
blastomeres
PGCs
endoderm
axial mesoderm
muscle
mural cells /
non-skeletal muscle
mesenchyme
hematopoietic /
vasculature
pronephros
neural
spinal cord / glia
eye
taste / olfactory
otic / lateral line
epidermis
periderm
fin
ionocytes / mucous
pigment cells
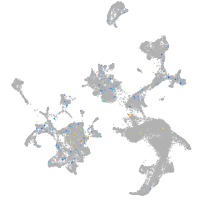
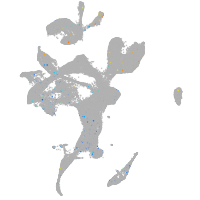
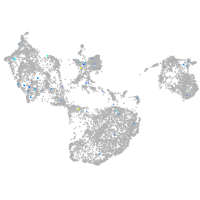
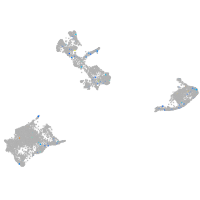
Expression by stage/cluster
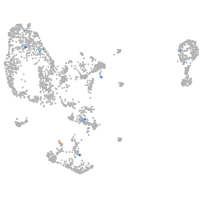
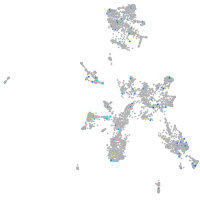
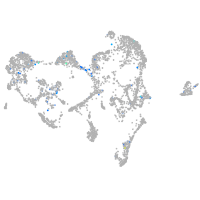
Correlated gene expression
Positive correlation
Negative correlation
Gene
r
Gene
r
si:dkey-193b15.8
0.198
gamt
-0.068
LOC101884923
0.189
gapdh
-0.066
LOC110437937
0.185
gatm
-0.061
XLOC-026841
0.161
glud1b
-0.058
si:dkey-238d18.5
0.157
fbp1b
-0.057
CR457444.5
0.152
bhmt
-0.055
CR388231.1
0.147
ahcy
-0.054
LOC100004033
0.147
apoa1b
-0.053
BX890539.1
0.136
gpx4a
-0.052
b4galt2
0.136
apoa4b.1
-0.052
glis1a
0.132
afp4
-0.052
esrrgb
0.130
mat1a
-0.051
RBP1 (1 of many)
0.130
apoc2
-0.051
CABZ01050238.1
0.127
pnp4b
-0.050
CABZ01053323.1
0.123
gcshb
-0.050
LOC108179166
0.122
aldob
-0.049
asic4a
0.119
apoa2
-0.049
rln
0.119
cx32.3
-0.048
syngap1b
0.114
apobb.1
-0.046
myrf
0.114
si:dkey-16p21.8
-0.046
CR388008.1
0.113
suclg2
-0.045
si:dkeyp-75b4.7
0.112
aqp12
-0.045
LOC100535133
0.111
agxtb
-0.045
adcy2a
0.110
ftcd
-0.045
znf1127
0.109
apoc1
-0.044
syn3
0.109
abat
-0.044
LOC101885478
0.109
scp2a
-0.044
ttc25
0.109
cx28.9
-0.044
LOC108183289
0.109
eno3
-0.044
XLOC-000527
0.108
serpina1l
-0.043
valopa
0.108
zgc:123103
-0.043
si:ch211-202c21.7
0.108
pygl
-0.043
DISP3
0.108
pla2g12b
-0.043
FP103048.1
0.107
mgst1.2
-0.043
zmp:0000001069
0.107
cyp4v8
-0.042