Daniocell
sgip1b (blastomeres)
SH3GL interacting endocytic adaptor 1b
ZFIN
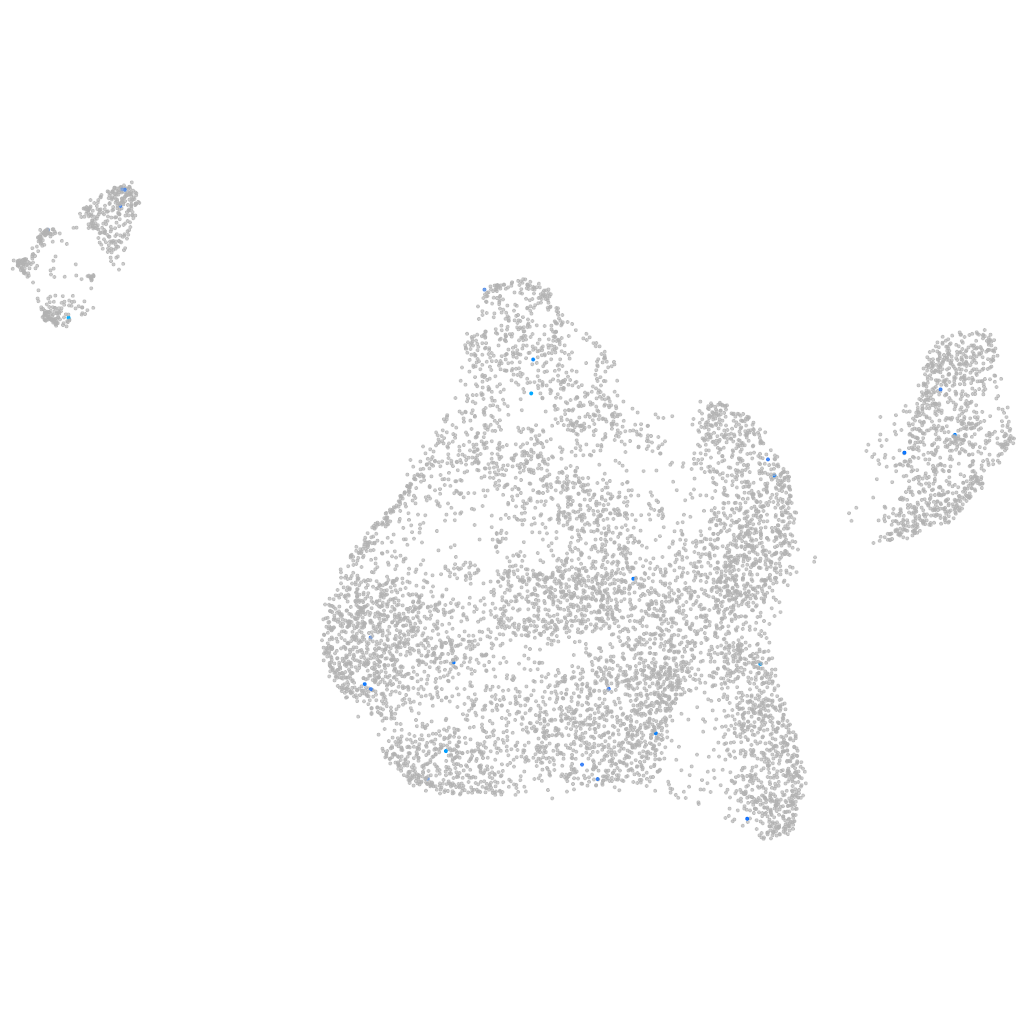
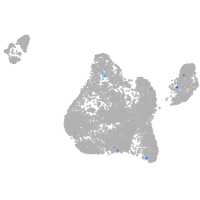
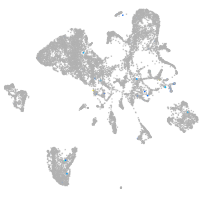
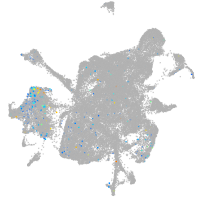
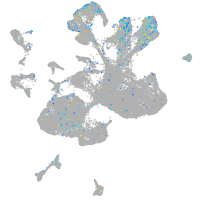
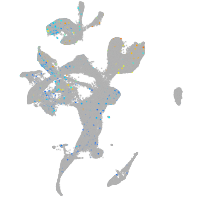
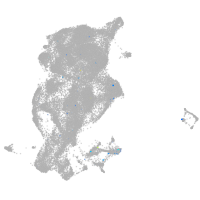
Gene expression UMAP
Display:
Expression
Stage
Other cell groups
all cells
blastomeres
PGCs
endoderm
axial mesoderm
muscle
mural cells /
non-skeletal muscle
mesenchyme
hematopoietic /
vasculature
pronephros
neural
spinal cord / glia
eye
taste / olfactory
otic / lateral line
epidermis
periderm
fin
ionocytes / mucous
pigment cells
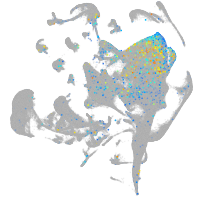
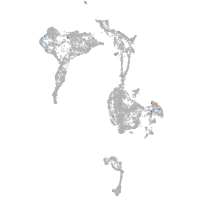
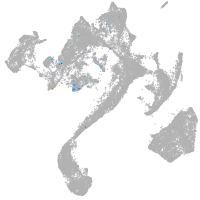
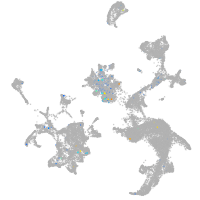
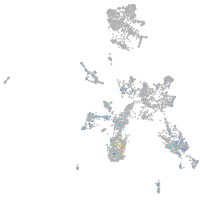
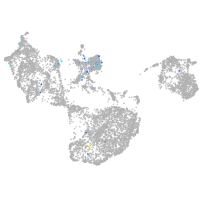
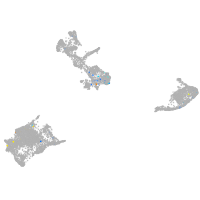
Expression by stage/cluster
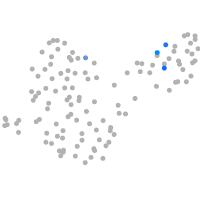
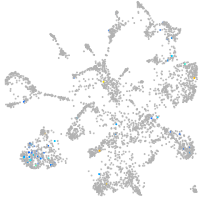
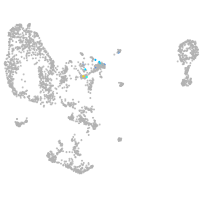
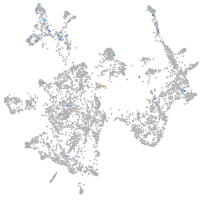
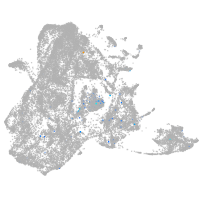
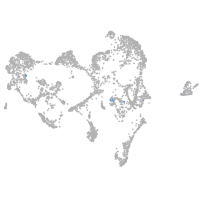
Correlated gene expression
Positive correlation
Negative correlation
Gene
r
Gene
r
si:dkey-238j22.1
0.276
bsg
-0.037
grin1b
0.208
mt-co2
-0.033
tmprss7
0.207
rack1
-0.028
barx2
0.196
actb1
-0.027
ano8a
0.178
si:ch211-222l21.1
-0.027
mhc1zda
0.175
tcp1
-0.026
pde8b
0.161
rpl9
-0.025
znf1110
0.139
polr3gla
-0.025
XLOC-030503
0.138
polr2j
-0.025
NC-002333.22
0.135
ctsd
-0.025
npy7r
0.135
h2afvb
-0.024
rasal1b
0.132
lsm7
-0.023
XLOC-040040
0.128
cox4i1
-0.023
ADAM12
0.124
tex261
-0.023
LOC110438297
0.123
sumo3a
-0.023
si:ch211-160d14.15
0.119
aph1b
-0.023
ptk6b
0.119
ube2l3a
-0.023
si:dkey-188g12.1
0.118
CR847936.1
-0.023
si:dkey-22f5.9
0.115
chmp1b
-0.022
LOC101886621
0.114
hnrnpul1
-0.022
chst3a
0.111
si:ch73-1a9.3
-0.022
XLOC-011871
0.109
hnrnpl2
-0.022
paqr4a
0.109
ergic3
-0.021
LOC103910873
0.105
LOC108190024
-0.021
BX005392.1
0.105
si:ch211-191j22.3
-0.021
tnk2a
0.104
bud23
-0.021
nrn1lb
0.101
si:ch211-133n4.4
-0.021
CT573344.1
0.101
swt1
-0.021
pdcb
0.100
fubp1
-0.021
epx
0.100
fkbp7
-0.020
cadpsa
0.097
si:ch211-152c2.3
-0.020
zmp:0000000951
0.095
rpl15
-0.020
LOC110438414
0.095
cenpx
-0.020
AL833789.1
0.095
rplp2l
-0.020
si:dkey-92j16.2
0.094
rps27.1
-0.020