Daniocell
sftpbb (eye)
surfactant protein Bb
ZFIN
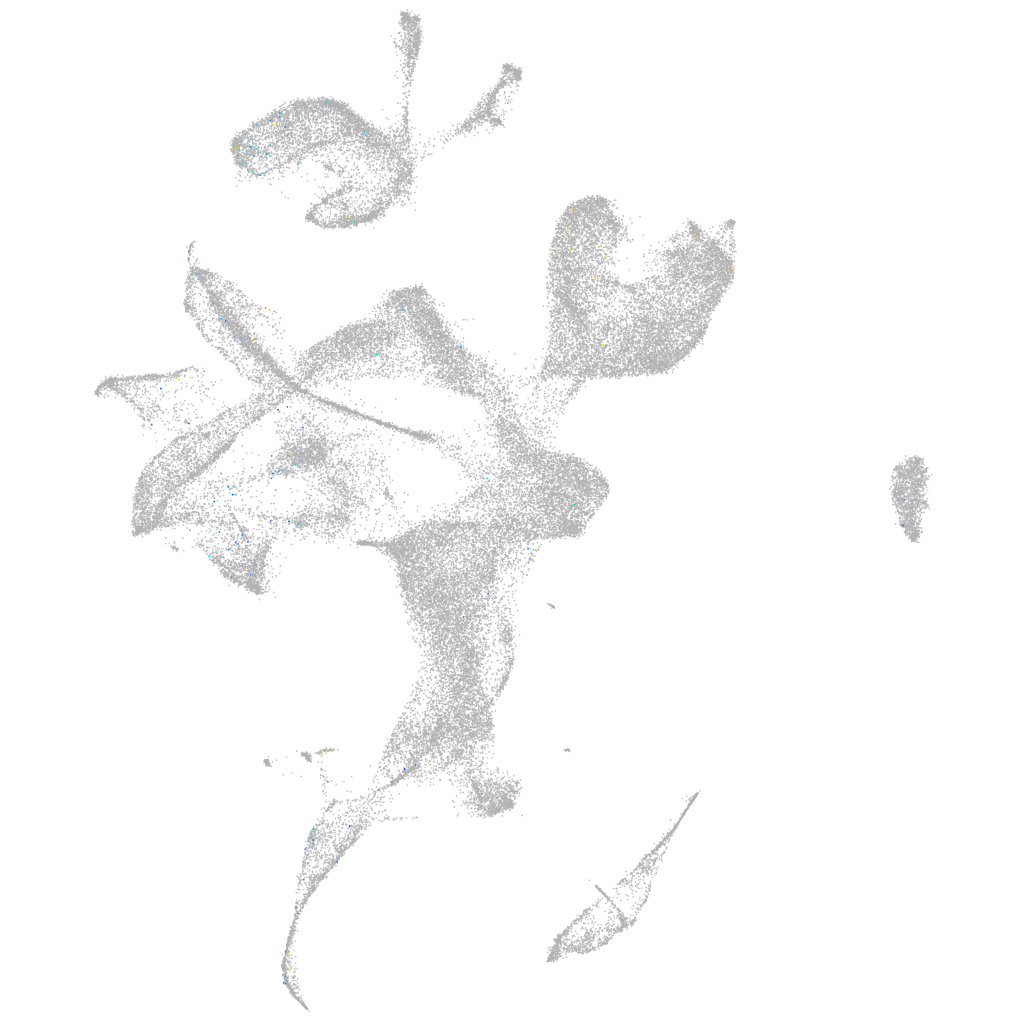
Gene expression UMAP
Display:
Expression
Stage
Other cell groups
all cells
blastomeres
PGCs
endoderm
axial mesoderm
muscle
mural cells /
non-skeletal muscle
mesenchyme
hematopoietic /
vasculature
pronephros
neural
spinal cord / glia
eye
taste / olfactory
otic / lateral line
epidermis
periderm
fin
ionocytes / mucous
pigment cells
Expression by stage/cluster
Correlated gene expression
Positive correlation
Negative correlation
Gene
r
Gene
r
CT573344.2
0.144
hmga1a
-0.035
LOC110440131
0.134
hmgb2a
-0.035
LOC101883054
0.117
si:dkey-151g10.6
-0.034
p2ry2.1
0.101
hmgb2b
-0.033
XLOC-019672
0.098
rpl39
-0.032
ifnphi1
0.096
rpl23
-0.031
ifit16
0.090
rplp2l
-0.031
LOC101883999
0.081
rps12
-0.030
LOC103908820
0.081
rpl32
-0.030
lpxn
0.078
rpl19
-0.030
cxcl19
0.078
rps14
-0.030
tor4ab
0.077
rpsa
-0.028
LO017843.1
0.076
eef1a1l1
-0.028
LOC101884250
0.074
rps9
-0.028
zgc:171844
0.072
rps21
-0.027
cacna1ea
0.071
tpt1
-0.027
LO018584.1
0.070
rpl21
-0.027
si:dkey-1h24.6
0.069
rpl36a
-0.027
f2r
0.068
rpl26
-0.027
si:dkeyp-73d8.8
0.067
ddx39ab
-0.027
CR854941.1
0.064
rpl13
-0.027
si:ch211-120k19.1
0.064
rplp0
-0.026
si:ch211-188i4.4
0.063
rps5
-0.026
si:dkey-228a15.1
0.062
rps27a
-0.026
CU929146.1
0.062
rpl18a
-0.026
ugt2a3
0.062
rpl23a
-0.026
nmbr
0.061
rps25
-0.026
sv2a
0.060
rps20
-0.026
LOC100150882
0.059
rpl10a
-0.026
tnfrsf18
0.059
rps3a
-0.026
NPC1L1
0.058
rpl12
-0.026
cd27
0.058
si:ch211-222l21.1
-0.025
LOC103911067
0.057
rps28
-0.025
CU074419.1
0.057
rpl7a
-0.025
FO393424.2
0.057
rps29
-0.025