Daniocell
sfmbt2 (hematopoietic / vasculature)
Scm like with four mbt domains 2
ZFIN
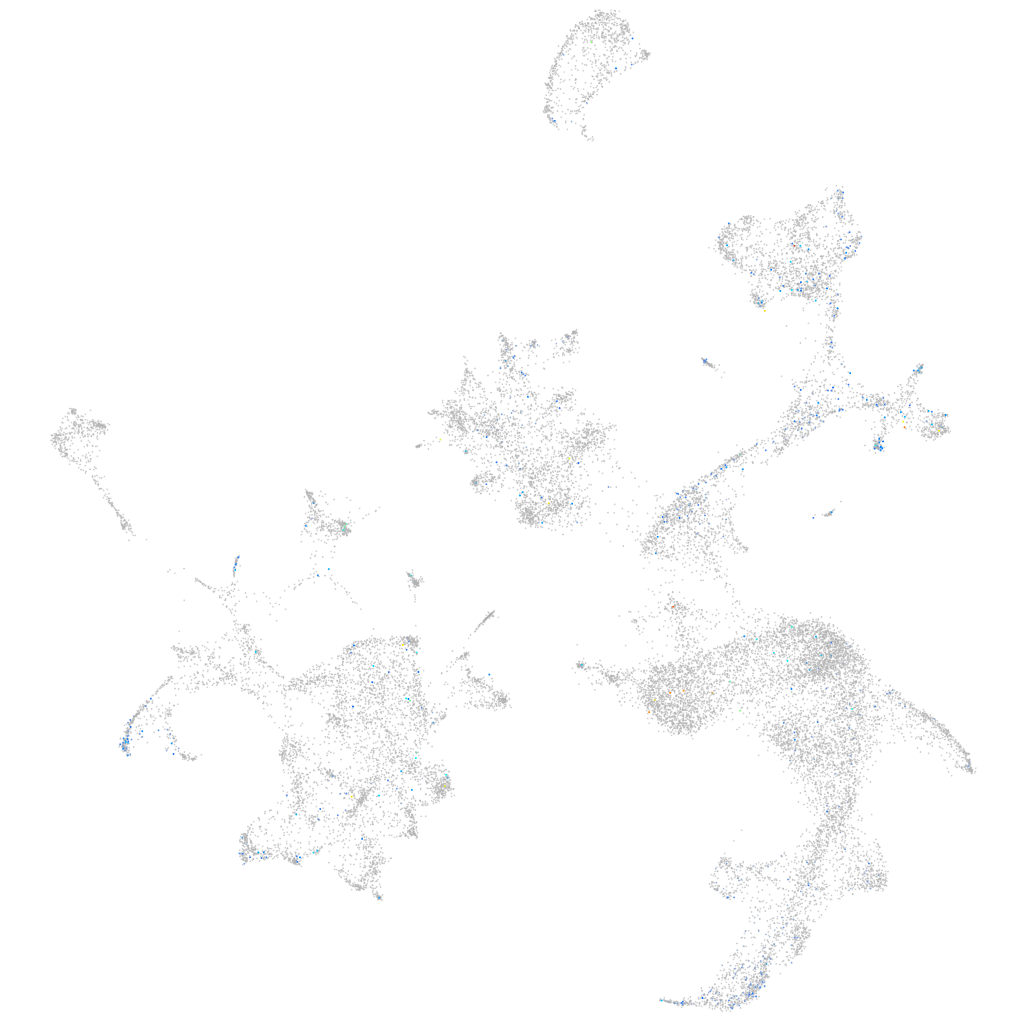
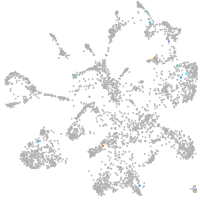
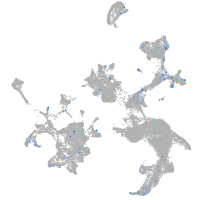
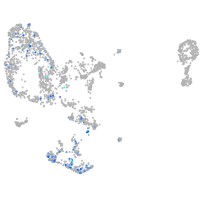
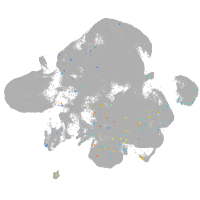
Gene expression UMAP
Display:
Expression
Stage
Other cell groups
all cells
blastomeres
PGCs
endoderm
axial mesoderm
muscle
mural cells /
non-skeletal muscle
mesenchyme
hematopoietic /
vasculature
pronephros
neural
spinal cord / glia
eye
taste / olfactory
otic / lateral line
epidermis
periderm
fin
ionocytes / mucous
pigment cells
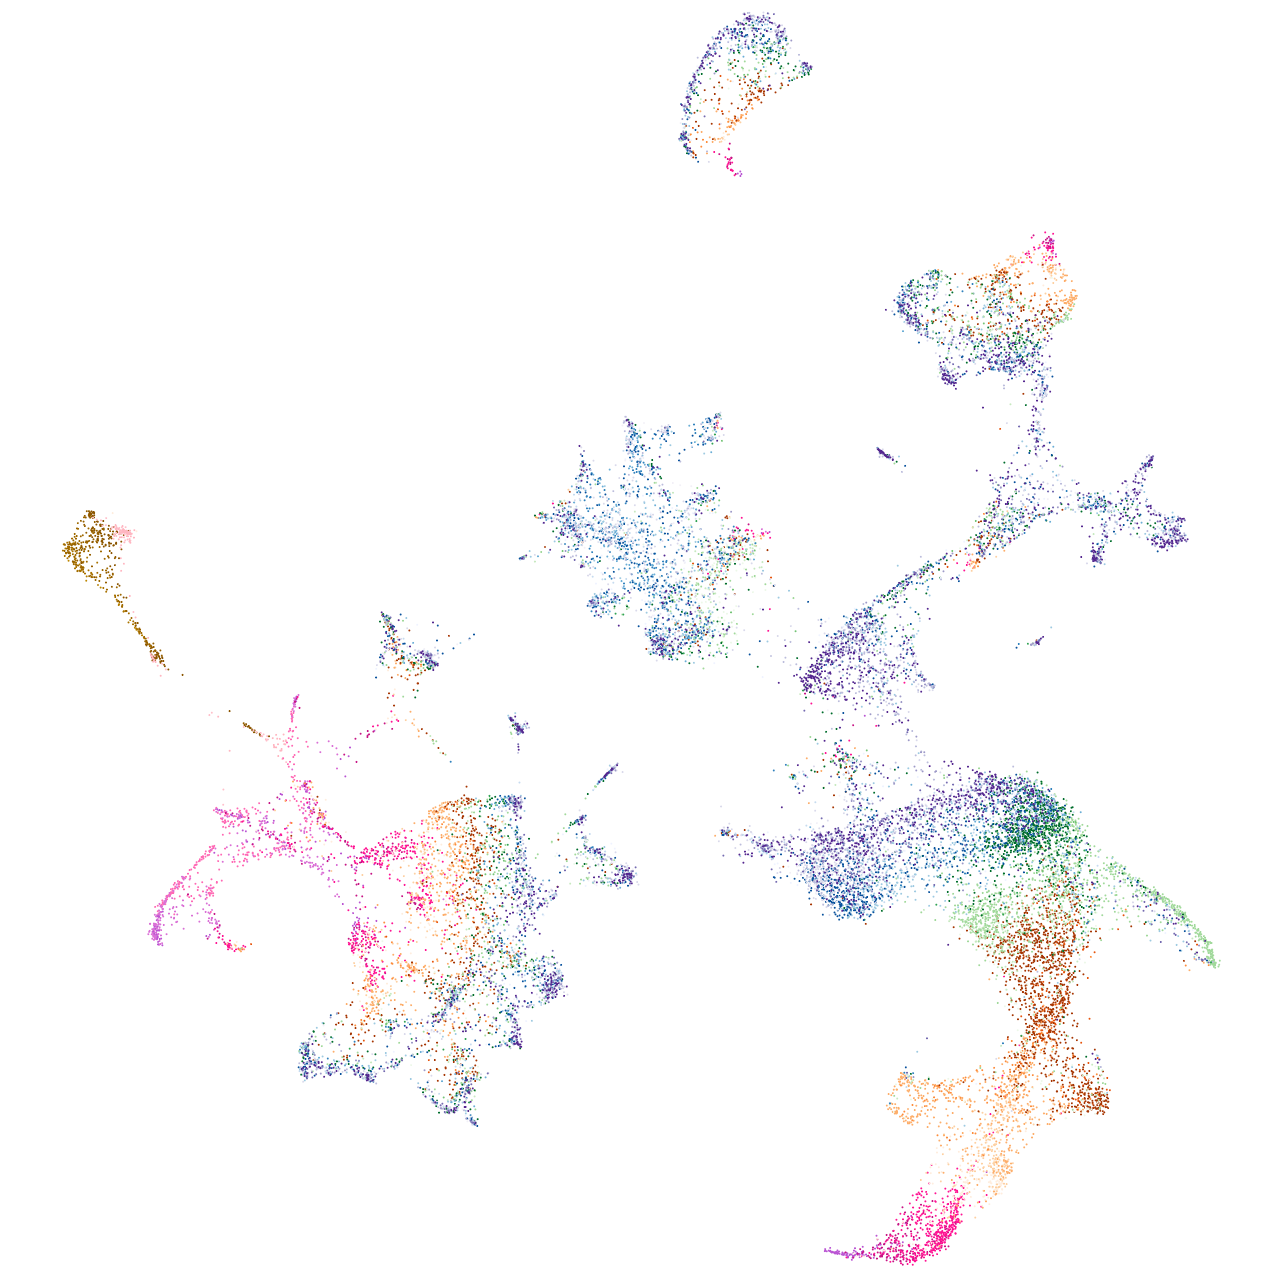
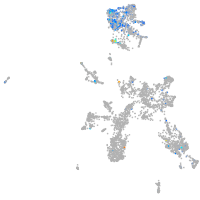
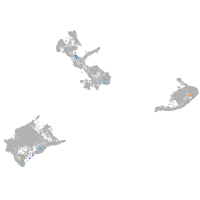
Expression by stage/cluster
Correlated gene expression
Positive correlation
Negative correlation
Gene
r
Gene
r
FO681472.1
0.138
hbbe2
-0.039
si:ch211-218o21.4
0.132
hbbe1.3
-0.038
si:dkey-11o18.5
0.114
hbae3
-0.038
nmba
0.109
si:ch211-207c6.2
-0.038
valopa
0.097
si:ch211-250g4.3
-0.036
CR847973.1
0.090
hbbe1.1
-0.036
znf1028
0.086
hbae1.3
-0.034
si:ch211-261n11.8
0.086
cahz
-0.034
si:dkey-203a12.7
0.081
tmod4
-0.033
si:dkey-58f10.6
0.081
hbae1.1
-0.033
si:ch211-66k16.2
0.079
plac8l1
-0.033
XLOC-016512
0.078
hbbe1.2
-0.032
si:dkey-238d18.12
0.077
hemgn
-0.032
XLOC-044244
0.076
creg1
-0.031
LOC101883520
0.073
zgc:92606
-0.030
nos2a
0.073
faxdc2
-0.027
kynu
0.073
selenoj
-0.027
si:ch73-180n10.1
0.072
nt5c2l1
-0.027
si:dkey-91i10.3
0.071
zgc:56095
-0.026
CR788255.1
0.070
tspo
-0.026
ftsj3
0.070
gp9
-0.024
znf1084
0.069
si:ch211-103n10.5
-0.022
BX005105.1
0.067
gpx1a
-0.022
si:dkey-102m7.3
0.067
fth1a
-0.021
rnf32
0.067
hmgb3a
-0.021
si:dkey-74h17.3
0.066
LOC108179634
-0.020
XLOC-042915
0.066
her15.1
-0.020
XLOC-022269
0.065
nprl3
-0.020
LOC101883622
0.065
fscn1a
-0.020
rpf2
0.064
si:ch211-227m13.1
-0.020
BX323801.1
0.064
slc4a1a
-0.020
abcc6b.2
0.063
adssl1
-0.019
si:dkey-261j4.4
0.063
si:dkey-240n22.3
-0.019
tmx1
0.062
add2
-0.018
osbpl9
0.062
si:ch211-217a12.1
-0.018