Daniocell
sdk2b (endoderm)
sidekick cell adhesion molecule 2b
ZFIN
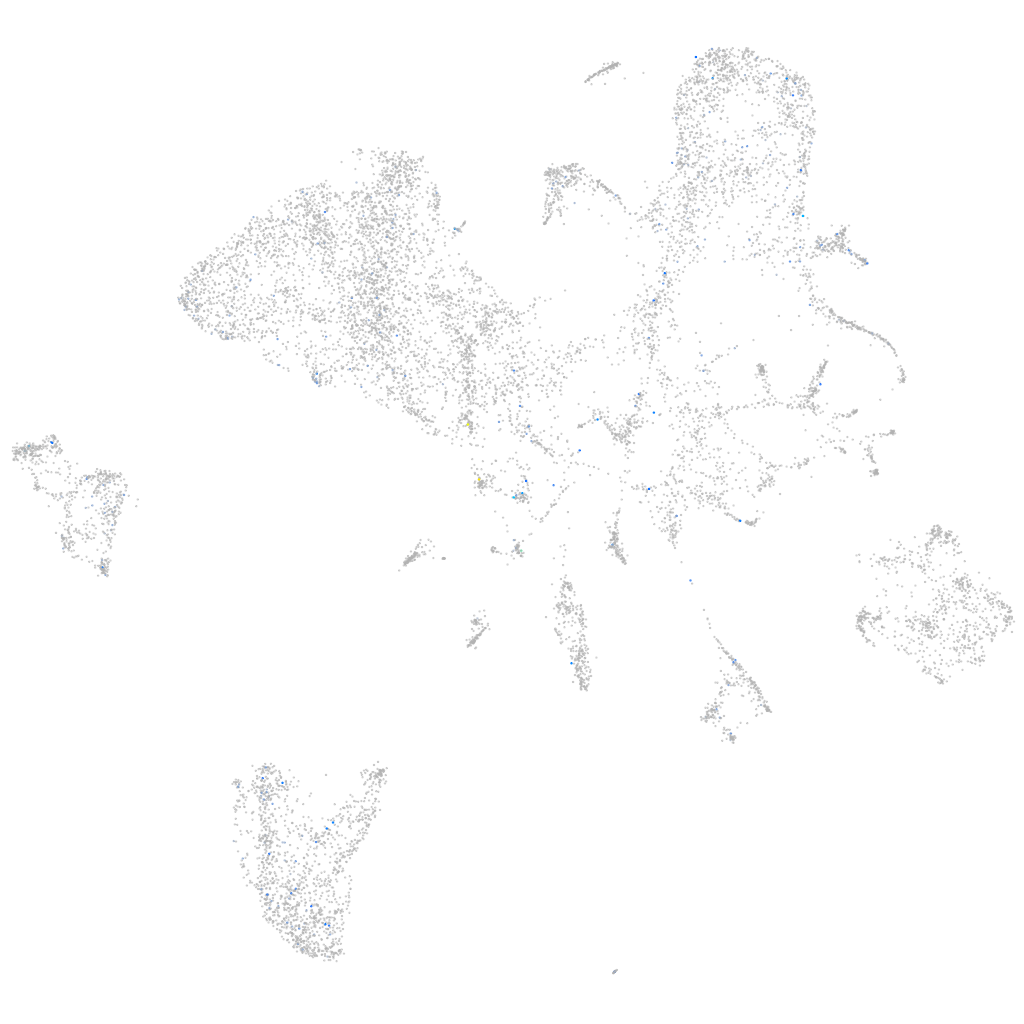
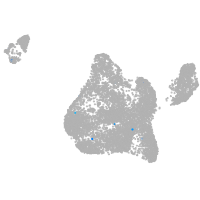
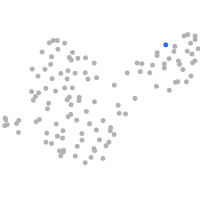
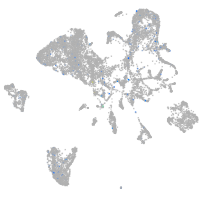
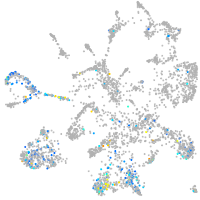
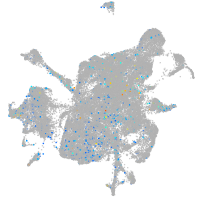
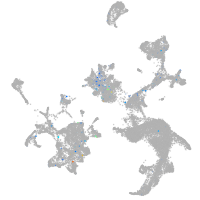
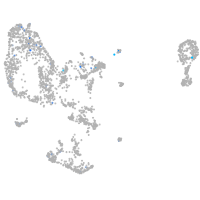
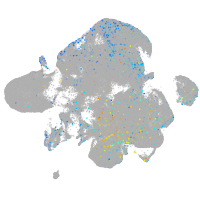
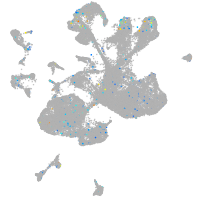
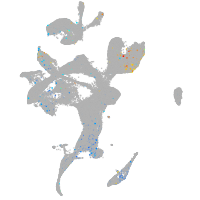
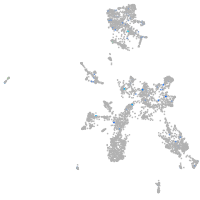
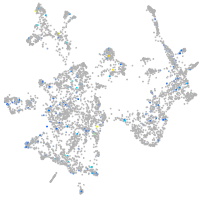
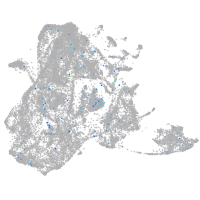
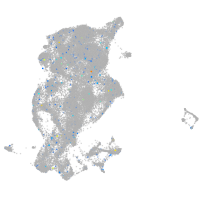
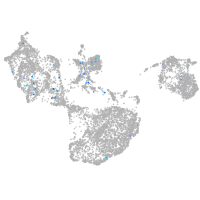
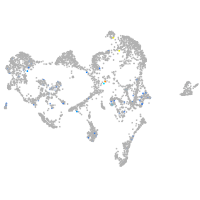
Gene expression UMAP
Display:
Expression
Stage
Other cell groups
all cells
blastomeres
PGCs
endoderm
axial mesoderm
muscle
mural cells /
non-skeletal muscle
mesenchyme
hematopoietic /
vasculature
pronephros
neural
spinal cord / glia
eye
taste / olfactory
otic / lateral line
epidermis
periderm
fin
ionocytes / mucous
pigment cells
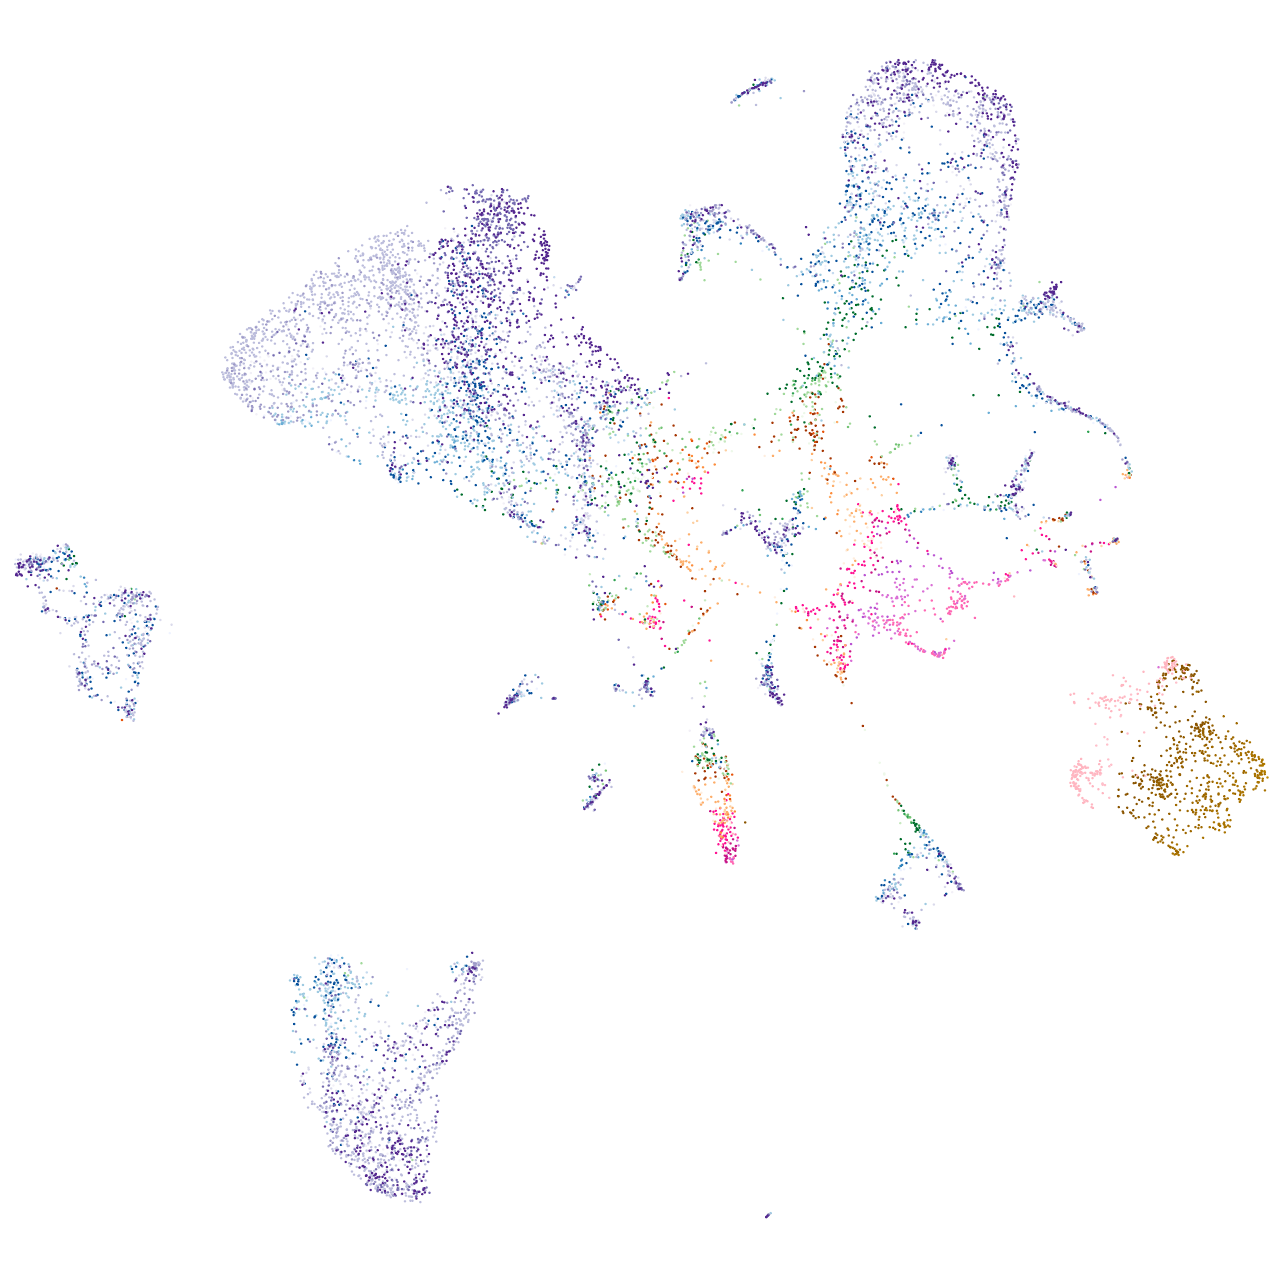
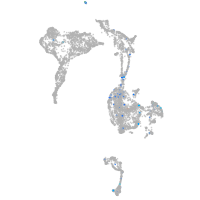
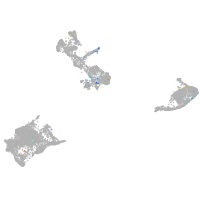
Expression by stage/cluster
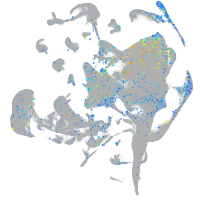
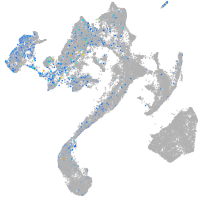
Correlated gene expression
Positive correlation
Negative correlation
Gene
r
Gene
r
arhgap23b
0.295
apoc1
-0.043
CABZ01118575.1
0.289
hspb1
-0.035
ankrd6a
0.260
akap12b
-0.030
XLOC-043742
0.255
apela
-0.029
si:ch211-108c6.2
0.250
vox
-0.028
si:ch211-266k22.6
0.229
fetub
-0.028
si:dkeyp-4c4.1
0.228
si:ch211-152c2.3
-0.028
LOC108192008
0.226
comtd1
-0.027
CU929294.1
0.223
rbp2b
-0.027
odf3b
0.222
wu:fb97g03
-0.027
si:ch211-276c2.2
0.222
apom
-0.027
si:ch211-195b15.7
0.211
ttr
-0.027
zmp:0000000545
0.208
cdh6
-0.027
lrrc3
0.206
lect2l
-0.027
rdh8b
0.197
LOC110437731
-0.026
wasf3a
0.193
fam50a
-0.026
si:dkeyp-9d4.2
0.180
ces2
-0.026
xcr1a.1
0.177
sp5l
-0.026
gucy2f
0.169
si:dkey-86l18.10
-0.026
si:dkey-38l22.2
0.169
cdx4
-0.026
cabp5b
0.166
hnrnpd
-0.026
XLOC-026746
0.163
fabp10a
-0.025
slc17a7a
0.162
sox32
-0.025
rcvrna
0.157
rbp4
-0.025
rab44
0.156
cxcr4a
-0.025
slc4a10b
0.155
crp3
-0.025
kcnab2b
0.154
s100a1
-0.025
cnrip1b
0.152
pltp
-0.024
samd7
0.151
sox17
-0.024
si:ch73-380n15.2
0.150
qpct
-0.024
rgs11
0.142
fscn1a
-0.024
gabra4
0.141
cpn1
-0.024
BX663503.1
0.138
wu:fj16a03
-0.024
CR936482.1
0.137
gc
-0.023
si:dkey-191g9.5
0.137
ces3
-0.023