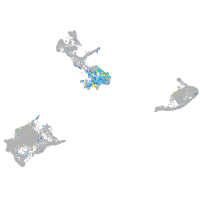
scratch family zinc finger 2
ZFIN 
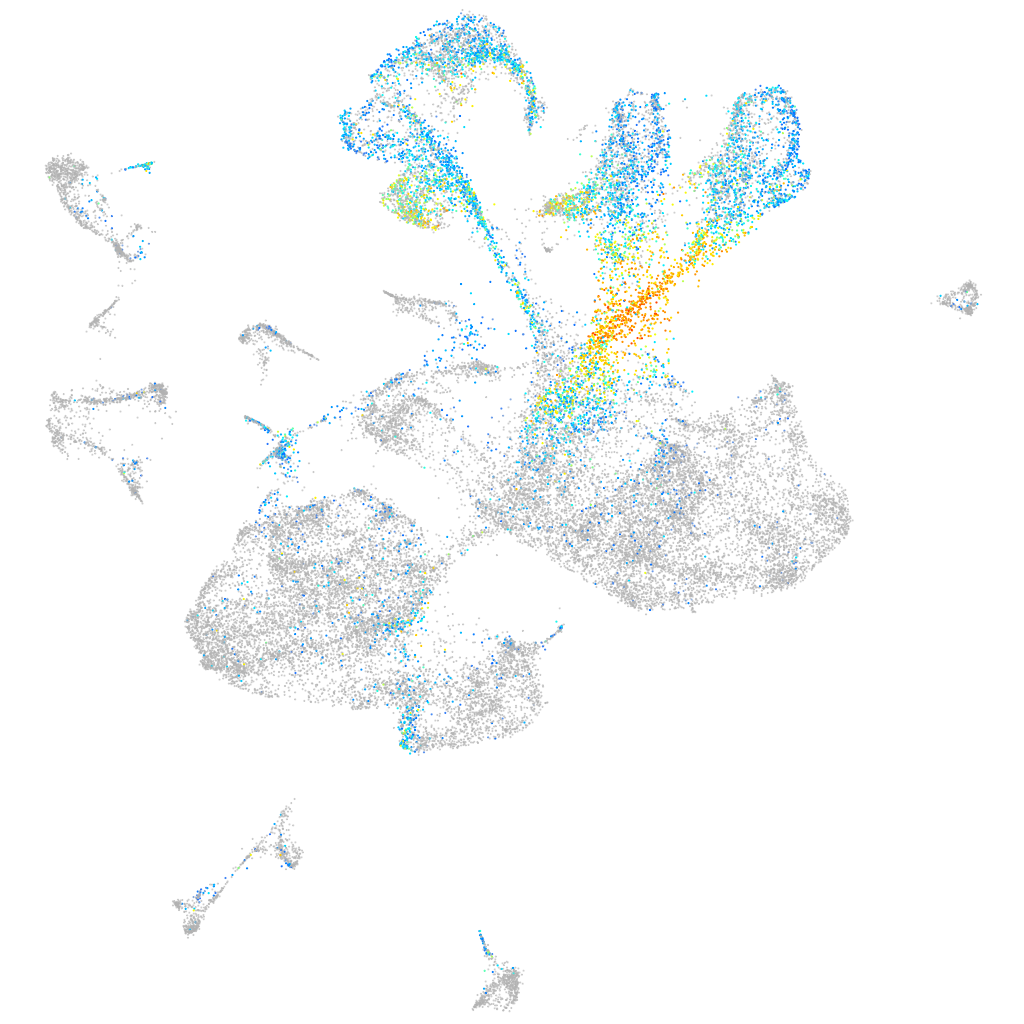
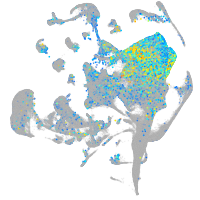
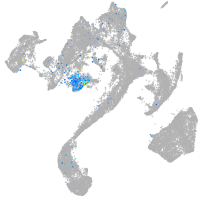
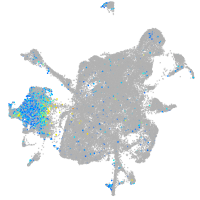
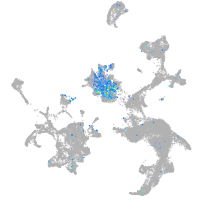
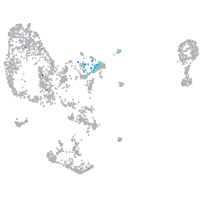
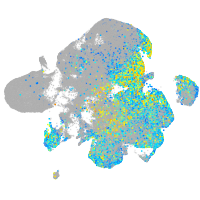
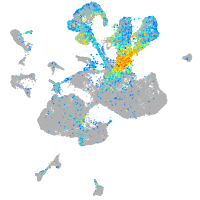
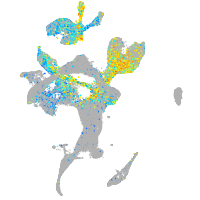
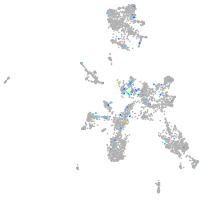
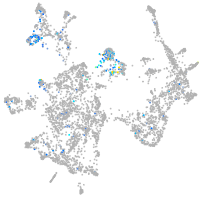
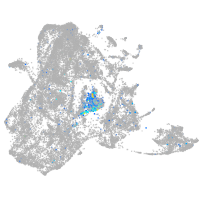
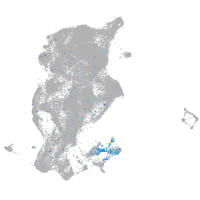
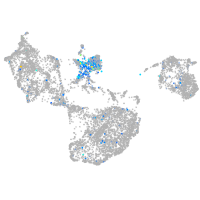
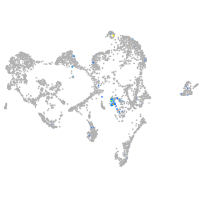
Expression by stage/cluster


Correlated gene expression


| Positive correlation | Negative correlation | ||
| Gene | r | Gene | r |
| nhlh2 | 0.563 | id1 | -0.350 |
| elavl3 | 0.531 | fosab | -0.281 |
| myt1b | 0.504 | msna | -0.279 |
| scrt1a | 0.499 | cldn5a | -0.272 |
| LOC100537384 | 0.439 | XLOC-003690 | -0.269 |
| ebf2 | 0.436 | vamp3 | -0.257 |
| myt1a | 0.418 | cd82a | -0.249 |
| dlb | 0.412 | sdc4 | -0.248 |
| insm1b | 0.402 | mdka | -0.246 |
| lima1a | 0.376 | fabp7a | -0.238 |
| stap2a | 0.374 | atp1a1b | -0.238 |
| ebf3a | 0.373 | pcna | -0.233 |
| rtn1a | 0.372 | sox2 | -0.231 |
| zgc:77784 | 0.368 | tuba8l | -0.226 |
| stmn1b | 0.367 | selenoh | -0.223 |
| jagn1a | 0.360 | dut | -0.221 |
| insm1a | 0.356 | msi1 | -0.220 |
| si:ch73-386h18.1 | 0.354 | si:ch73-281n10.2 | -0.216 |
| epb41a | 0.353 | qki2 | -0.215 |
| pax2b | 0.349 | si:ch73-265d7.2 | -0.215 |
| zfhx3 | 0.347 | her2 | -0.215 |
| tmeff1b | 0.346 | zfp36l1a | -0.213 |
| tmsb | 0.345 | tuba8l4 | -0.213 |
| atcaya | 0.340 | hmgb2a | -0.212 |
| uncx | 0.340 | ccnd1 | -0.209 |
| gng2 | 0.338 | sox19a | -0.209 |
| pik3r3b | 0.335 | cd63 | -0.208 |
| elovl4a | 0.332 | COX7A2 (1 of many) | -0.208 |
| lhx1b | 0.332 | her12 | -0.208 |
| thsd7aa | 0.329 | psat1 | -0.207 |
| ube2ql1 | 0.328 | notch3 | -0.206 |
| spsb4a | 0.327 | sparc | -0.205 |
| onecut2 | 0.325 | sox3 | -0.204 |
| ywhah | 0.324 | atp1b1a | -0.204 |
| tp53inp2 | 0.323 | her6 | -0.204 |


