Daniocell
scmh1 (glial cells / spinal cord)
Scm polycomb group protein homolog 1
ZFIN
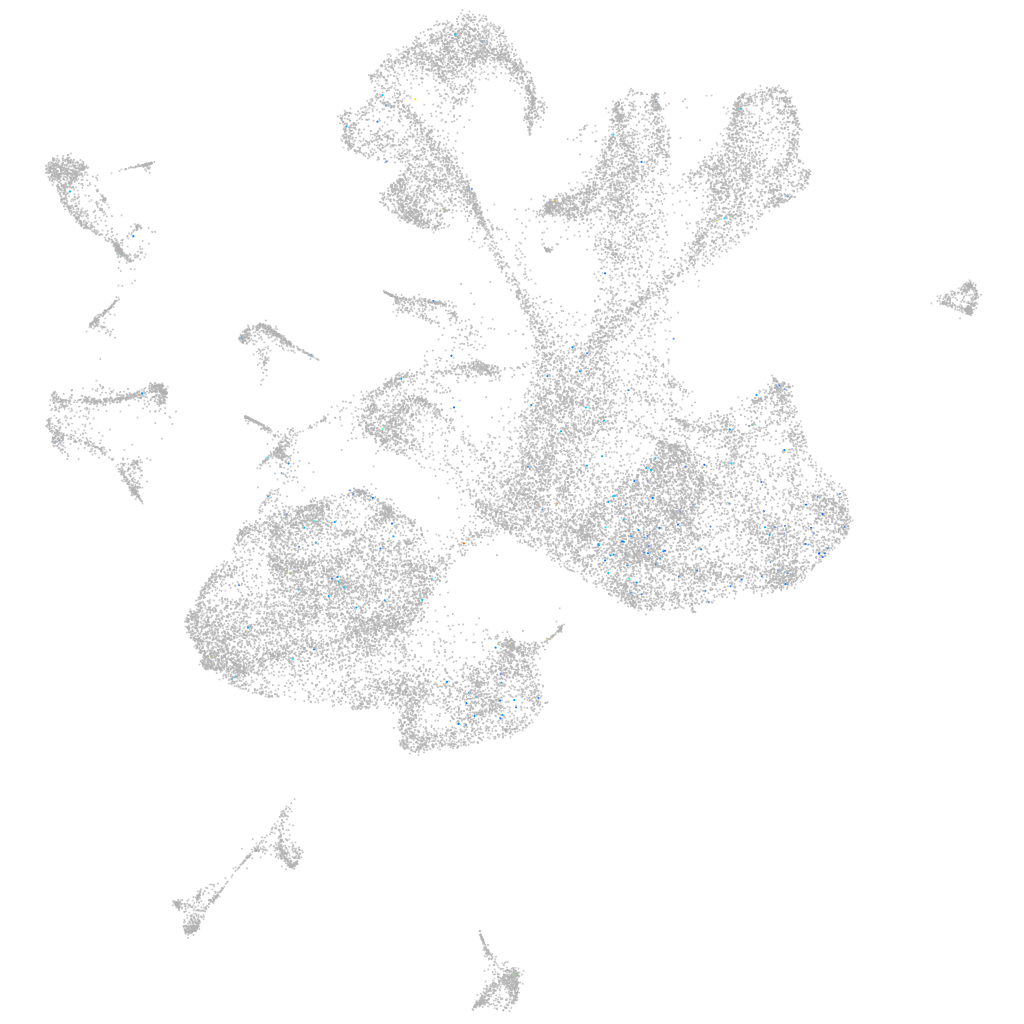
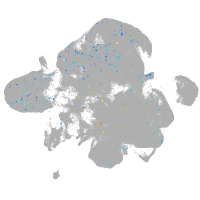
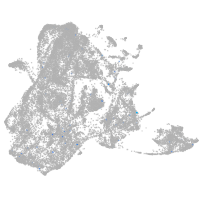
Gene expression UMAP
Display:
Expression
Stage
Other cell groups
all cells
blastomeres
PGCs
endoderm
axial mesoderm
muscle
mural cells /
non-skeletal muscle
mesenchyme
hematopoietic /
vasculature
pronephros
neural
spinal cord / glia
eye
taste / olfactory
otic / lateral line
epidermis
periderm
fin
ionocytes / mucous
pigment cells
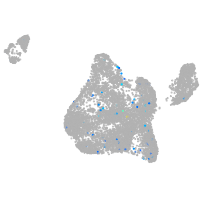
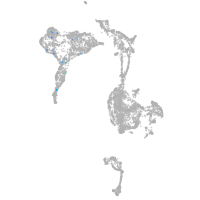
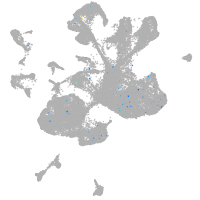
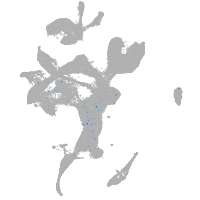
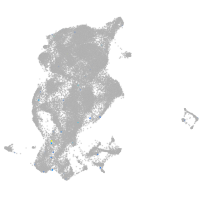
Expression by stage/cluster
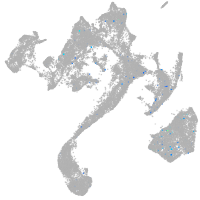
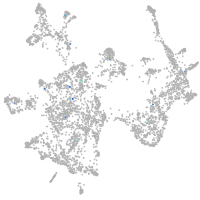
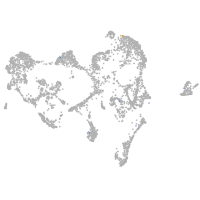
Correlated gene expression
Positive correlation
Negative correlation
Gene
r
Gene
r
BX957344.1
0.174
ppdpfb
-0.018
LOC110439474
0.098
elavl3
-0.018
RF00443
0.085
rab10
-0.018
BX248512.2
0.083
gabarapb
-0.018
XLOC-020170
0.081
ywhag2
-0.018
pimr81
0.079
rtn1a
-0.018
or106-8
0.076
cpeb4b
-0.018
si:ch73-256j6.3
0.072
vdac3
-0.017
LOC103911431
0.067
hbbe1.3
-0.017
si:ch211-217i17.1
0.067
brk1
-0.017
CABZ01051600.1
0.066
zc4h2
-0.017
igfals
0.065
hp1bp3
-0.017
aste1a
0.061
gabarapa
-0.017
LOC569097
0.060
dynlrb1
-0.017
si:ch211-236g6.1
0.060
sncb
-0.017
si:dkey-22h13.5
0.059
gpm6ab
-0.016
gnrhr4
0.058
map1lc3b
-0.016
mibp
0.056
tmx2b
-0.016
LOC110439905
0.056
mllt11
-0.016
znf987
0.056
dazap2
-0.016
BX908740.1
0.055
calm1a
-0.016
or106-6
0.055
ckbb
-0.016
BX005305.1
0.055
jagn1a
-0.016
si:ch211-116o3.3
0.054
sh3gl2a
-0.016
LOC103912043
0.054
ywhae1
-0.016
CABZ01005379.1
0.054
actb2
-0.015
chaf1a
0.053
stxbp1a
-0.015
KCNK12
0.053
atp6v1g1
-0.015
ugt1b7
0.050
selenot1a
-0.015
XLOC-017471
0.050
rnasekb
-0.015
LOC100536981
0.050
necap1
-0.015
rrm1
0.048
vamp2
-0.015
capga
0.047
zgc:101840
-0.015
pcna
0.047
marcksl1b
-0.015
si:dkeyp-77c4.5
0.047
smap1
-0.015