Daniocell
sagb (blastomeres)
S-antigen%3B retina and pineal gland (arrestin) b
ZFIN
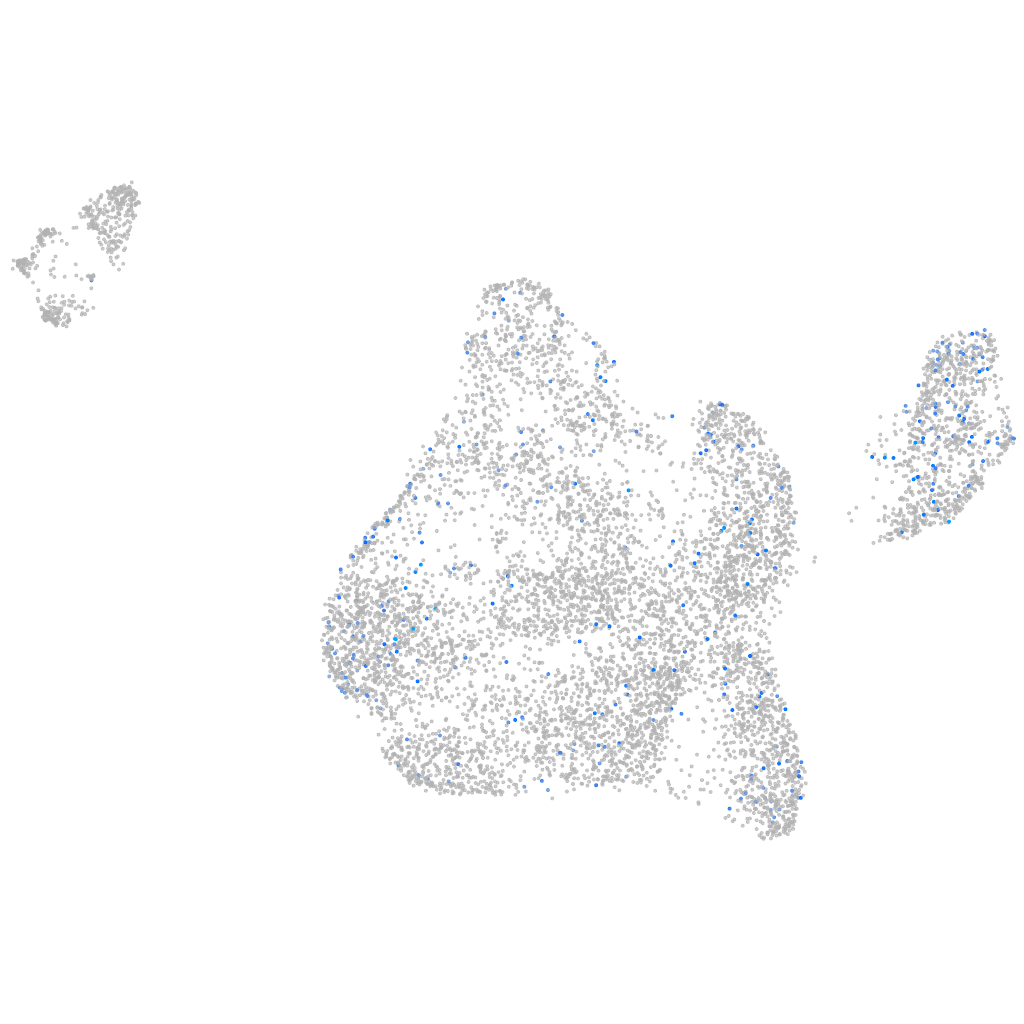
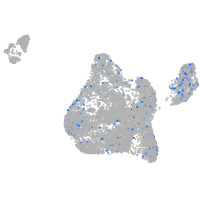
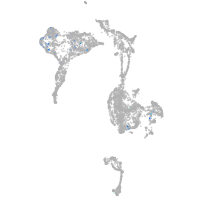
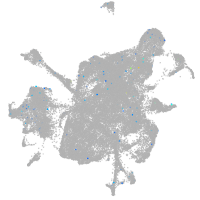
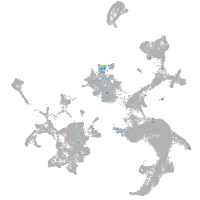
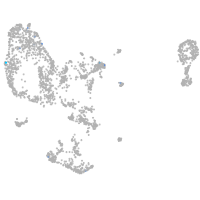
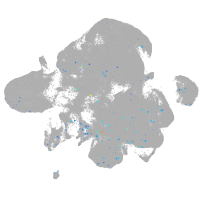
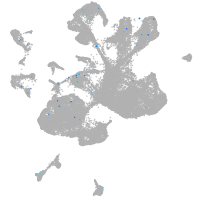
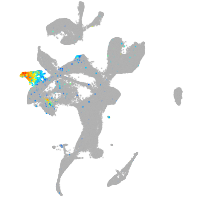
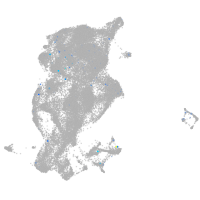
Gene expression UMAP
Display:
Expression
Stage
Other cell groups
all cells
blastomeres
PGCs
endoderm
axial mesoderm
muscle
mural cells /
non-skeletal muscle
mesenchyme
hematopoietic /
vasculature
pronephros
neural
spinal cord / glia
eye
taste / olfactory
otic / lateral line
epidermis
periderm
fin
ionocytes / mucous
pigment cells
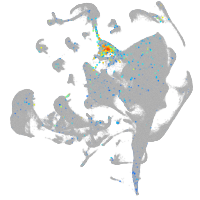
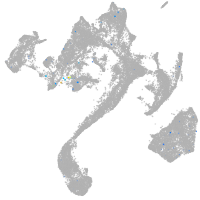
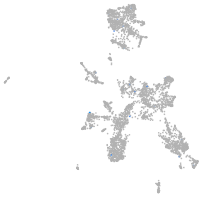
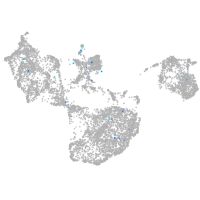
Expression by stage/cluster
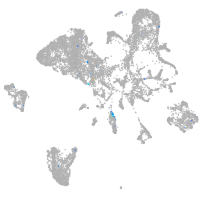
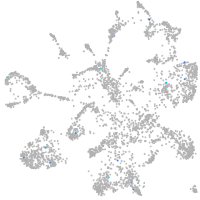
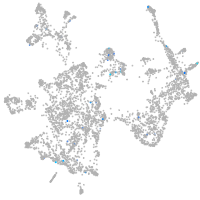
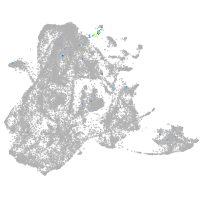
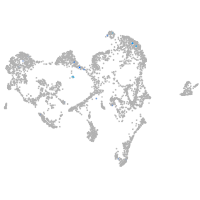
Correlated gene expression
Positive correlation
Negative correlation
Gene
r
Gene
r
kcnt1
0.100
NC-002333.4
-0.058
mettl24
0.100
hsp90aa1.2
-0.043
sod3b
0.094
serpinh1b
-0.039
XLOC-010286
0.088
si:dkey-108k21.10
-0.036
LOC110439324
0.088
zgc:110216
-0.036
FP325358.1
0.082
apela
-0.035
slc38a3b
0.076
casp3a
-0.032
CU469568.3
0.076
pgam1a
-0.032
si:ch73-281i18.7
0.074
chordc1b
-0.031
zgc:171887
0.074
her3
-0.031
vtg1
0.074
xpr1b
-0.030
XLOC-043679
0.074
fam120c
-0.030
nptx2a
0.073
zgc:113263
-0.029
fpr1
0.070
mt-nd5
-0.029
LOC110439442
0.070
hnrnpua
-0.028
CR769772.3
0.070
rad51ap1
-0.028
srsf5a
0.070
usp40
-0.027
si:ch211-105f12.2
0.069
si:ch211-220f16.2
-0.027
CABZ01087091.1
0.069
fosab
-0.027
CT030005.2
0.068
litaf
-0.027
LOC110438870
0.067
pdap1a
-0.027
LOC103911722
0.067
zgc:162509
-0.026
LOC100536116
0.067
dusp1
-0.026
inpp4b
0.066
crsp7
-0.026
XLOC-026713
0.066
phax
-0.026
mir18a
0.065
apoc1
-0.026
XLOC-002539
0.064
mrpl45
-0.026
pabpc1a
0.064
fbxl3a
-0.026
si:dkey-65b12.6
0.063
zgc:162879
-0.026
LOC101883789
0.062
ppil4
-0.026
mst1rb
0.062
si:dkeyp-104f11.6
-0.026
crygm2d12
0.062
trappc4
-0.026
ccna2
0.062
XLOC-026578
-0.026
LOC101885541
0.061
otx2a
-0.026
pimr82
0.061
ubxn7
-0.026