Daniocell
rxfp3.3b (blastomeres)
relaxin family peptide receptor 3.3b
ZFIN
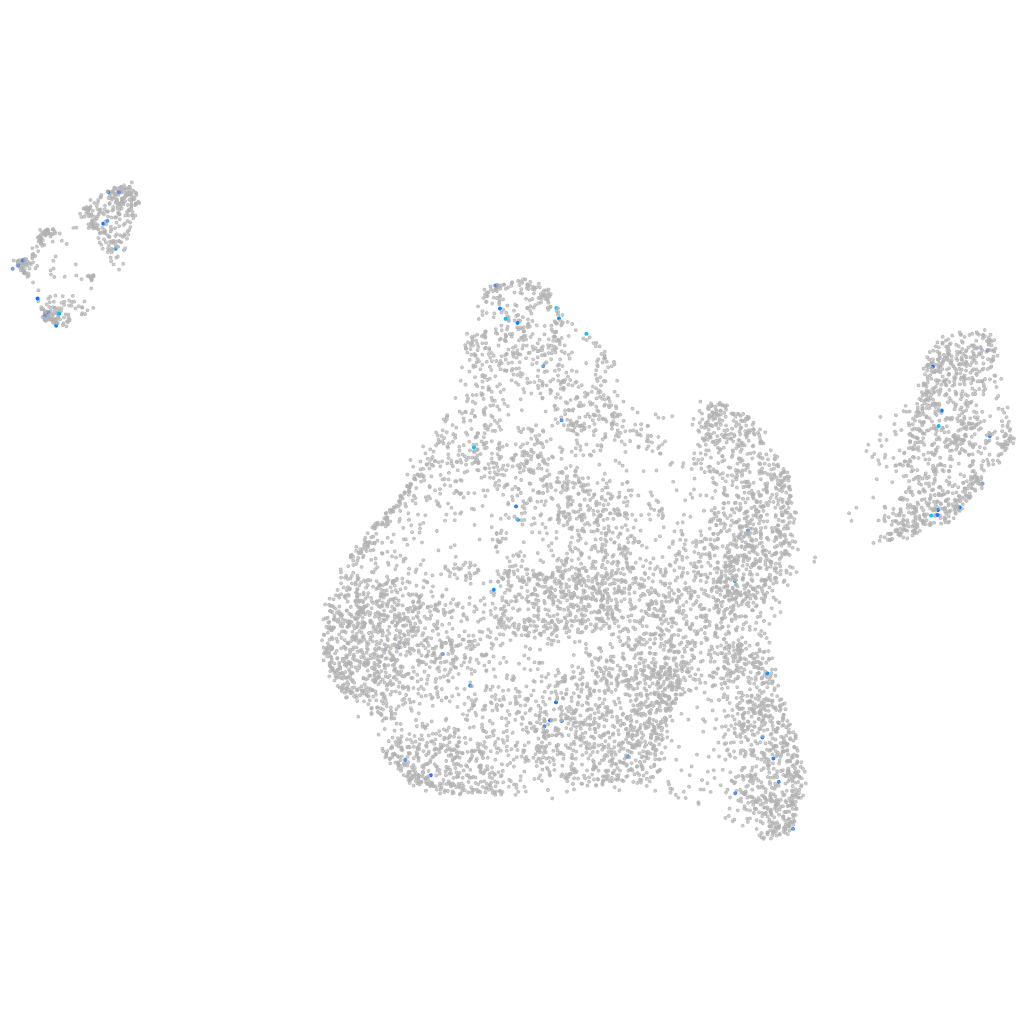
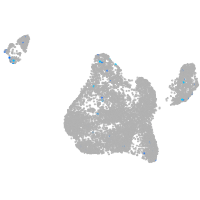
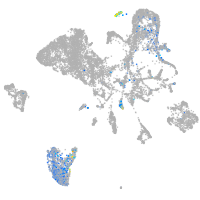
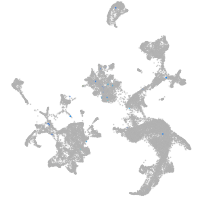
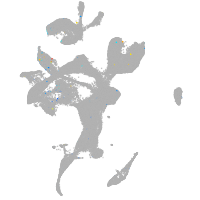
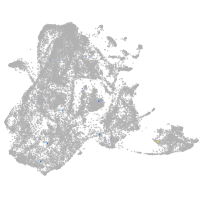
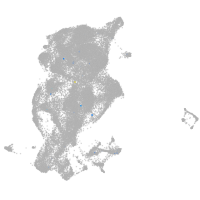
Gene expression UMAP
Display:
Expression
Stage
Other cell groups
all cells
blastomeres
PGCs
endoderm
axial mesoderm
muscle
mural cells /
non-skeletal muscle
mesenchyme
hematopoietic /
vasculature
pronephros
neural
spinal cord / glia
eye
taste / olfactory
otic / lateral line
epidermis
periderm
fin
ionocytes / mucous
pigment cells
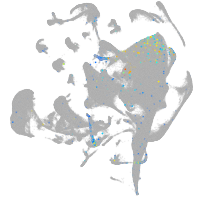
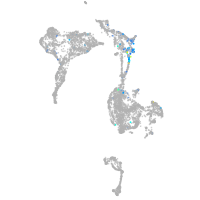
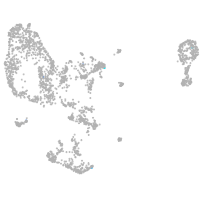
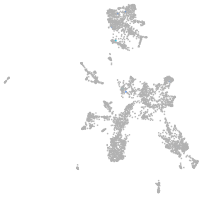
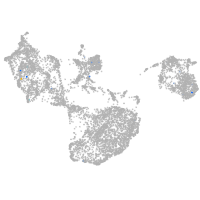
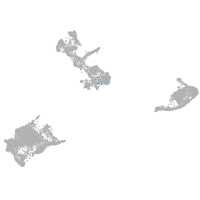
Expression by stage/cluster
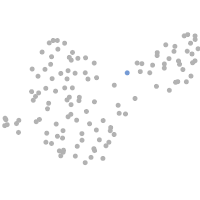
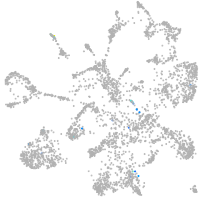
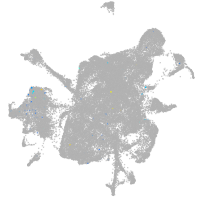
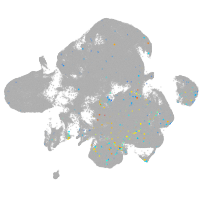
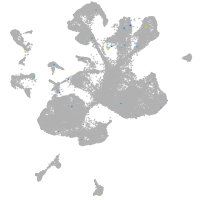
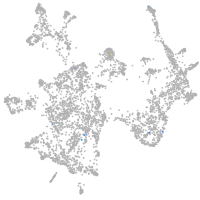
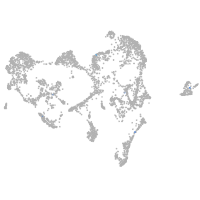
Correlated gene expression
Positive correlation
Negative correlation
Gene
r
Gene
r
CR855311.4
0.226
aldob
-0.060
cpa2
0.194
si:ch73-1a9.3
-0.060
XLOC-025051
0.191
id1
-0.059
LOC795083
0.177
stm
-0.052
si:dkey-247k7.2
0.165
si:ch1073-80i24.3
-0.051
XLOC-003396
0.160
si:ch211-152c2.3
-0.049
CU694317.1
0.152
anp32b
-0.048
si:ch73-242m19.1
0.151
rps23
-0.048
BX546499.2
0.145
si:ch211-222l21.1
-0.048
avpr1ab
0.142
polr3gla
-0.048
si:ch211-236k19.2
0.142
marcksl1b
-0.047
CT573392.1
0.139
rpl39
-0.046
BX537280.1
0.138
rps26l
-0.046
nkx2.4b
0.137
si:dkey-151g10.6
-0.046
si:dkey-112a7.5
0.134
si:dkey-56m19.5
-0.045
LOC101884772
0.126
hnrnpa0b
-0.045
LOC110440096
0.126
dynll1
-0.044
impg1a
0.123
hspb1
-0.043
NRXN2
0.122
srsf5a
-0.043
rcvrn3
0.116
naca
-0.043
rln3b
0.116
snrpf
-0.042
CU459012.3
0.115
rpsa
-0.041
si:ch73-290k24.5
0.113
rpl14
-0.041
fosl1b
0.110
hnrnpa0a
-0.041
negaly6
0.105
ran
-0.041
zgc:113232
0.105
rps29
-0.040
LOC101884976
0.103
rpl10
-0.040
zgc:194189
0.103
atp1b1a
-0.040
fam20cl
0.102
fam50a
-0.040
RF00421
0.100
sox19a
-0.040
si:dkey-58j15.10
0.100
rps28
-0.038
syt6b
0.100
anp32e
-0.038
CT574585.2
0.099
rplp1
-0.038
LO017711.1
0.099
foxd5
-0.038
sstr3
0.097
rps21
-0.038