Daniocell
rsad1 (mural cells / non-skeletal muscle)
radical S-adenosyl methionine domain containing 1
ZFIN
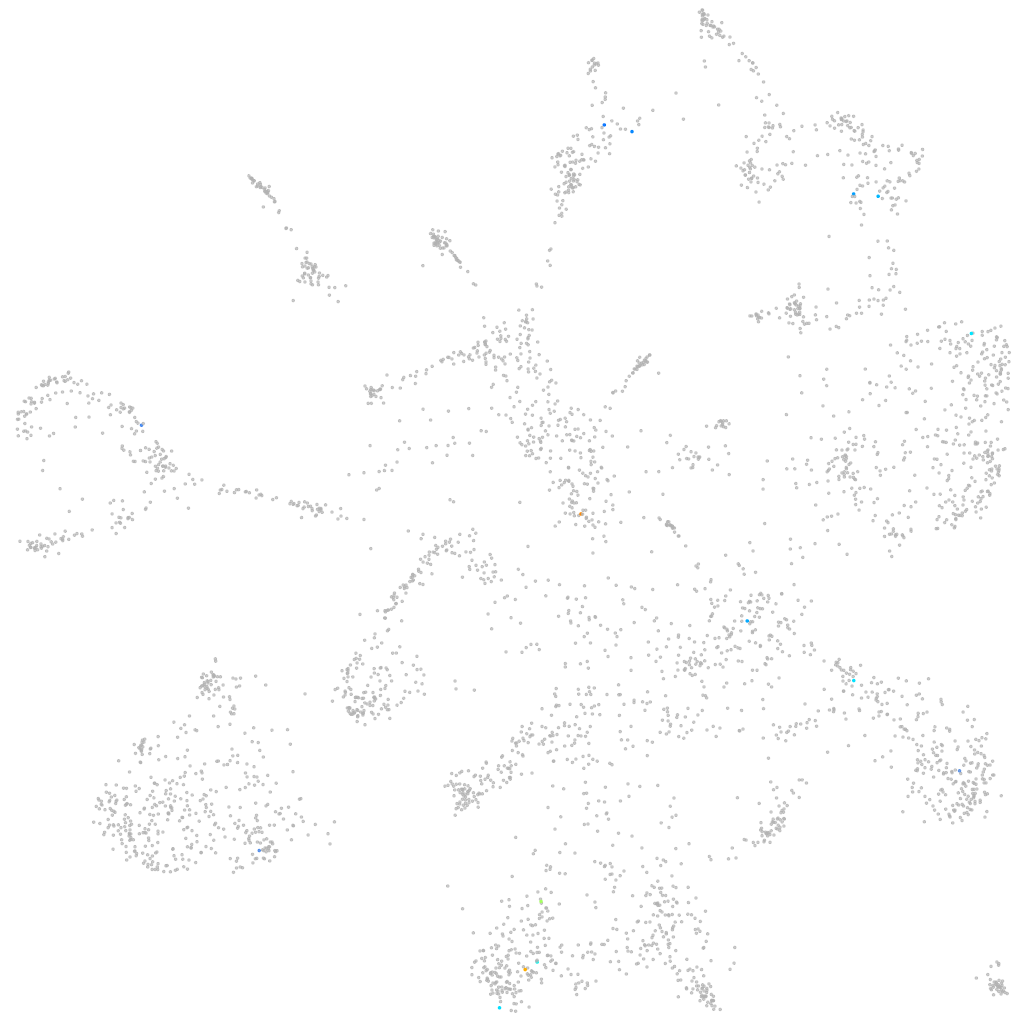
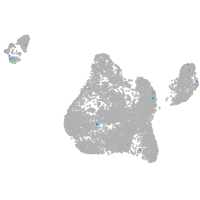
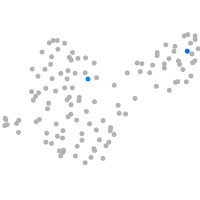
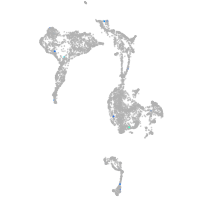
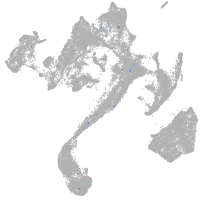
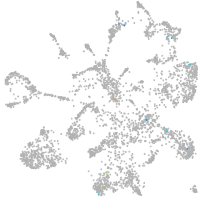
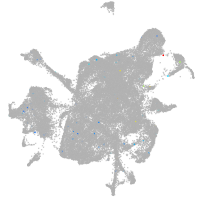
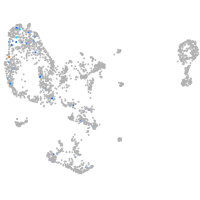
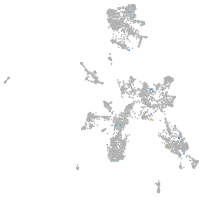
Gene expression UMAP
Display:
Expression
Stage
Other cell groups
all cells
blastomeres
PGCs
endoderm
axial mesoderm
muscle
mural cells /
non-skeletal muscle
mesenchyme
hematopoietic /
vasculature
pronephros
neural
spinal cord / glia
eye
taste / olfactory
otic / lateral line
epidermis
periderm
fin
ionocytes / mucous
pigment cells
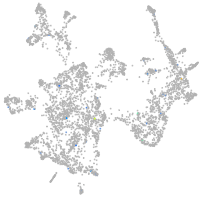
Expression by stage/cluster
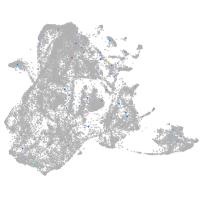
Correlated gene expression
Positive correlation
Negative correlation
Gene
r
Gene
r
ptprjb.1
0.391
rpl36
-0.043
LOC110438283
0.321
rpl5a
-0.043
si:ch211-282k23.2
0.271
rpl31
-0.042
zgc:103586
0.270
rps5
-0.040
zgc:77112
0.260
rpl18a
-0.039
psme4a
0.251
h2afy2
-0.038
CR931813.1
0.242
zgc:114188
-0.038
si:ch73-59f11.3
0.233
sec61g
-0.037
XLOC-043670
0.219
rpl27a
-0.037
tinf2
0.216
rps26l
-0.037
si:dkey-103j14.5
0.212
eif2s3
-0.036
slc22a4
0.209
mt-nd1
-0.035
ccm2l
0.208
faua
-0.035
sergef
0.201
naca
-0.035
zgc:174698
0.200
sumo2b
-0.035
XLOC-016096
0.200
cnbpb
-0.034
gabra5
0.198
vcp
-0.034
si:dkey-52j6.3
0.189
polr2f
-0.033
si:dkey-211f22.5
0.186
rpl38
-0.032
LOC108179085.1
0.186
phf5a
-0.032
si:dkey-222h21.7
0.181
hmgn2
-0.031
LOC108190033
0.181
ywhabl
-0.031
BX927101.1
0.175
pbdc1
-0.031
tlr19
0.174
rap1aa
-0.030
pex11a
0.174
h3f3a
-0.030
itgb2
0.171
fam168a
-0.029
gdpd4a
0.170
bcas2
-0.029
zbtb25
0.168
rps25
-0.029
si:dkey-266f7.9
0.165
apoa2
-0.029
LOC103912072
0.162
histh1l
-0.029
si:dkey-114l24.2
0.159
rpl32
-0.029
fam84b
0.158
ndufa6
-0.029
greb1
0.158
pdgfrb
-0.029
cart1
0.157
srsf7a
-0.028
si:ch211-170d8.8
0.156
sap30l
-0.028